Friday, October 14, 2016


Last Week

ES - After Monday’s meeting, price retreated to the 2115-2135 level to build support on the south slope of the 90 day composite POC.   It is clear from observing the drop off in participation above 2182 that price has little action to buy much higher.   Tuesday’s transition to this lower level was carried out by large lot traders, almost appearing as a panic and halted crisply in the vicinity of BREXIT, major trend lines, and Z16 contract lows.   Impressive…..  The gap low observed on Thursday was the return from the Yom Kippur holiday, a day that Jeff pointed out would be key.   Friday wrapped up the week.   There were several legitimate reversion trade entries last week.

The negative slope on the On Balance Volume indicator stands out.


NQ

Price action was similar to the ES but to different MP structural references - Retreating after a two week old newly formed barnacle island near 2.5% below all time highs back into the 90 day High Volume Area and executed a clean landing on the composite 90 day Point of Control.   


YESTERDAY'S Price Action:


To confirm the observations of the On Balanced Volume indicator, I'm checking the Commitment of Traders Report. It looks like Big Money (Smart Money) is continuing to leave the market...

Liquidating: Large Speculators, Asset Managers & Leveraged Funds
Buying: Small Speculators & Dealers


Liquidating Large Speculators & Commercial Speculators, Asset Managers and Dealers
Buying: Small Speculators & Leveraged Funds (!!!)
http://www.barchart.com/futures/cot.php#1

SUMMARY - If I were big money, not knowing what’s going to happen, I would be apt to simply stay in this region, filling in low volume areas, unloading supply onto retail investors, and make money simply moving inventory back and forth - Unless of course if something changes…

Wednesday, October 12, 2016

Rebalancing or Pausing?

Summary - Yesterday, the market made a large liquidation move lower. Today, while the liquidation continued, price was able to hold at value...


Top View Look

Bearish signals are apparent inspecting the negative slope of the On Balance Volume trend

After yesterday’s liquidation the NQ price has clearly been accepted into it’s 90 Day HVA/POC while the ES has slipped below its SMA200 where it building additional support would seem reasonable. Lower volume today suggests balancing (high volume would suggest panic, right?)

One interesting observation is that if we hang here long enough, we may have a chance to hit a major trend line and get to see what happens.
ES Liquidation Pausing on lower volume beneath SMA 200 - Either balancing or catching breath....

NQ at 90 day POC.


Market Profile View:

Summary - Tuesday's price was respected Monday's lows and the Globex levels for highs.

The NQ has trended lower for two consecutive days.   Wednesday’s Low of Day matched that from yesterday coinciding with a noticeable LVP in the composite. Wednesday’s price attempted to go higher upon release of the FOMC minutes but did not get past globex high nor the anomaly from yesterday.

If the NQ breaks lower, targets include the LVA south of the composite twin peaks.  If the high volume price at 4772 fails to hold lower, the MP & Pivots will be examined for further liquidation points.   Otherwise, the NQ appears to find the 90 day POC as support.
NQ support at 90 Day POC.   Possible LVA targets below.

The ES MP shows price did not match yesterday’s low.  As mentioned before, yesterday’s low is important because that level goes back the BREXIT time period and any lower would require pulling out older MP charts for reference.  

However, that might be what the market is needing to do (revisit BREXIT levels) that weren’t fully addressed during Z16 rollover? Because of the negative OBV trend line, continue to watch for lower target levels.
ES Did not exhibit panic liquidation today.  Watch for retesting for further liquidation & expecting LVA filling.


VOLUME:

ES DAILY VOLUME: 88% of average and less than yesterday
NQ DAILY VOLUME: 112% of average and less than yesterday

The ES shows fewer large lot traders throughout the day than yesterday.  This view also shows two ideal SMA bounce entries.  We can see the abundance of residual sell orders resulting from yesterday's action appear in the morning session.   However, the HVA at 2127 did a very good job.   The mid day rally campaign coincided with the release of the FOMC minutes.  In the the afternoon, liquidation occurred (again, stopping at the LOD) (WATCH FOR SELLING IN TOMORROW'S OPENING).
ES with Large Trader Filtering showing support at 2127 and slight selling tail at 14:30


The large lot traders were very apparent supporting price at the morning's low of day when residual sell orders opened the day.   Despite bringing price up midday, the afternoon was spent liquidating.  (LOOK FOR SHORTS IN THE MORNING OPENING TOMORROW)


VOLUME Continued - Despite today's settlement price being relatively close to yesterday's settle, the OBV shows lots of liquidation took place today.
Liquidation Day - Especially at cash closeout


Other - Pivot points appeared relevant for the High of Day.  All other pivot points too far out of range. Short time frame traders were in control today with respect for visual support/resistance levels.   Today’s flow was very choppy (is this indicative of being in a “fresh trading range”?)   


If I Were Big Money:

The negative trend on the OBV says continue a controlled liquidation holding value up as high as possible. Unfortunately, that would mean the retail traders and dealers are holding.

If I were big money, and couldn't maintain a balance here, a retreat back to contract lows come to mind. Perhaps a revisit to the contract low is in the future anyway?

Otherwise, if I were Big Money, I would also continue to try to hold a balance at these levels through the elections because those could be my orders....

If I were Big Money, I made my major move yesterday, continue my liquidation at these levels today, and will let the short time frame traders work it around here awhile -- Unless something happens.


An Independant Verification


Chris Ciovacco writes in an interesting article, "How Helpful Are 2 Consecutive S&P 500 Inside Weeks? " in Seeking Alpha, where he comments on how we've recently encountered two consecutive inside weeks - An infrequent signal...

Mr. Ciovacco was describing action on the SPY and in his analyses,  zooms out between 6-10 months.

Out of curiosity, I examined Mr. Ciovacco's findings on the ES market, and using eyeball methods, was able to identify two consecutive inside weeks in 2000, 2008 and the recent one in 2016 - I could not locate the one he identifies in June 2007 (perhaps due to the different market, different data feed, etc.)

In the comment section of this article, "brassb" pointed out that 2000, 2008 & 2016 are election years and in other readings, I recall markets tend to "clam up" when the outcome of the upcoming election is unclear (much as we have this year).

However, zoom out to a 20 year view,  striking price action follows the 2000 and 2008 trigger....

See it?


Tuesday, October 11, 2016

Columbus Holiday 2016 - The Day After

Summary

When I was a contractor to NASA, we would get caught up on Federal Holidays and when the government workforce returned, the place was abuzz as they often returned with “bright ideas”.   Today after Columbus Day, I think we’ve something similar….

Prelude: On Monday, Columbus day, volume was half the average as banks were closed.   Price was yet able to climb higher into areas previously rejected as too high.   Watching this,  I had a feeling that smaller operators were moving price higher so that they would establishes short positions without much squabble.   My volume data yesterday did not confirm this as the On Balance Volume reported net selling (perhaps retail buyers were buying at the highs?!?!?!)    

Sure enough at opening bell, price made a strong move back into last week’s popular trading areas (and lower), putting in  very pronounced selling tail.   


Price Action:

The piloting in the NQ and ES coupled with the magnitude of large lot trades demonstrated to me that long term traders played a major part of the price action - Bringing price back into the norm.

The NQ really impressed me making a low of day at the 90 day Point of Control.   If I were big money NQ, I would be happy here with all the uncertainty in the air to simply fill in the major LVAs here.   However, this does not jive with the big picture On Balance Volume.


Equally interesting was the controlled ES selloff to the Pre-Brexit all time high, a level which coincides with the 90 day Point of Control.   Very impressive piloting, indeed….   Bearish is the continuing decline of the On Balance Volume, what may be a complex top pattern, and price below the 90 day SMA200 - Items I’m sure the elections and earnings will iron out. Casio's famous quote comes to mind, "how much longer will this pig float?"


Peculiar about the action today was that while there was considerable large lot trading (long timeframe trader), price paused at nearly each and every S/R level, prior settling prices along the way (short timeframe trader).   Curious was Mr. Dalton would have to say about today if he were still around.   There were several legitimate reversion trade entries today.   Making entries difficult was the jungle of visual support/resistance levels.   My internet is impaired with an upload speed of only 0.2 Mbps making for lagged interactions - I chose to sit out today.   My loss…..


Volume - Inspection of the Institutional Volume Filtering showed large lot traders participating during this price move in the morning and the afternoon.  Coincidental that this level of action occur the day after Columbus day?   NQ volume was 116% of average compared to 125% from Friday (lighter!!!).   ES volume was  148% of average compared to 115% from Friday.   The ES drove the bus today.


On a side notion, while most of the sectors went lower, Utilities (blue) and Real Estate (yellow) went higher in the morning.  Leading the liquidation was Healthcare & Building (white & grey). Perhaps a sector rotation signal?   Not sure…. In the afternoon session, all sectors were liquidating.


Thoughts on trading tomorrow….   We haven’t been in this area for awhile so memories of MP structure may have diminished.   This could make for great opportunities.   To be continued...

Friday, October 7, 2016

The Lull Before the Storm...

Friday's Action and Steering into Next Week

Summary - We waited all week for today's job number what happened and didn't happen was pretty interesting and insightful on how to perhaps handle next week. Also today, Hurricane Matthew made landfall onto the eastern coast of the U.S. Today's action sorta reflected the waiting....


VOLUME

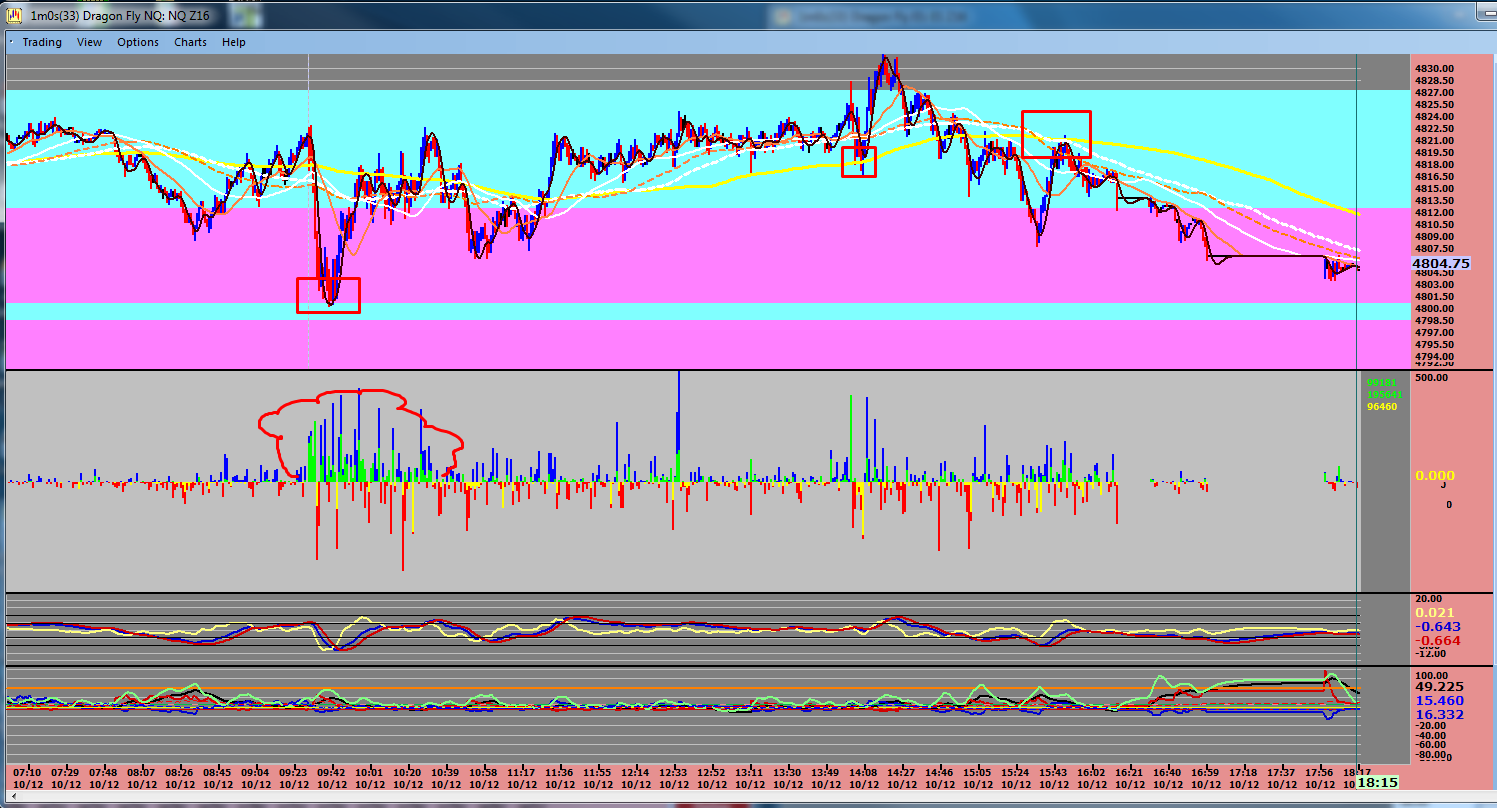
Increased volume activity began during the premarket session with the release of the jobs number at 08:30 and finished 115-125% above average. (I would like to connect the volume indicator to a noise maker to simulate a trading floor perhaps)

The On Balanced Volume shows continuing volume leaving the market.
.


I still have trouble wrapping my head around reading the tape but after reading Wychoff and some Volume Filtering, able to show strong large lot participation throughout the day and at key levels. The large lot participants in certain camps have been referred to as long term traders (yellow and green) while the small lot traders referred to as Short Term (red & blue).

When both the ES and NQ put in their low of day, the strong green buying in the NQ stands out (as it has the entire week) when provoked. I would like to think that the large lot buyers are spotted and becomes a signal for the small lot buyers to join in. Just a guess...
NQ with a Large & Small Lot Volume Tracker


ES with a Large & Small Lot Volume Tracker


STRUCTURE / ACTION

By essentially going nowhere, somebody was able to make a lot of money….

Both markets put in sharp selling tails at the open and in concert with the overall declining tendency of the OBV,  suggested the day would be one for liquidating.   The NQ HOD was off a defined HVA edge.  Also, the ES HOD cam right at defined long term trend lines.   Finally, both ES and NQ HOD’s were adjacent to yesterday’s settle price.  Lots of reasons to think short….    In recent days, it’s been demonstrated very difficult to get above these levels and with all the talk of interest rates, over valuations, etc, it will take some kind of doing in my opinion to proceed higher. Even more reason to perhaps follow the flip lower...
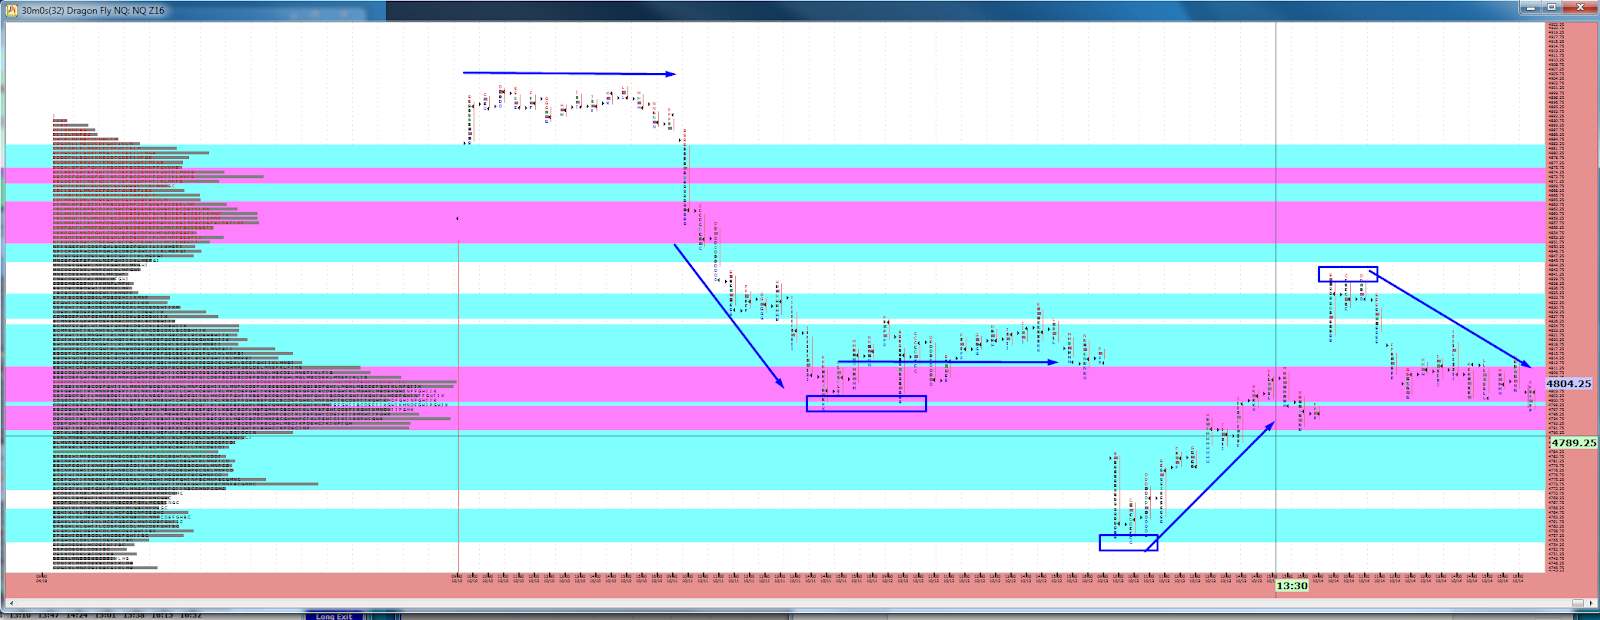
Market Profile of the Last Two Weeks
We've gone nowhere...


Until the London closing, prices stayed within the globex range until the London close and at 11:20, made final retests (globex POC, HVA edges, SMA 150) before a crash liquidation which promptly halted right before noon at defined HVA and fib levels one swing range right below yesterday’s Low of Day.    There were several reasons to believe price would go lower but it didn’t.   Close examination shows selling climax occurring at 12:23 right before lunch.  

We've gone nowhere in very rigid steps to very visible levels at some off usual times of day.

Trade continued in this region during lunch with strong buying support observed on the Institutional buying filters making these low of days pretty solid - In my opinion, it will take some really bad news to break below these levels.

The vertical distance from the morning swing lows to the low of the day created a great opportunity for a reversal (big bars down are often followed by big bars up) and that move came at 13:24, just before the bottom of the hour and finished at 13:50ish, both abnormal times since I’ve started keeping notes(I have been noting the time big moves take place seeking to understand the day in the life of a big money mover) - Perhaps these traders had plans for the Columbus Day weekend.   The climb off the low over the day was qualified with an SMA 150 retest before returning  it’s final range for the week.   

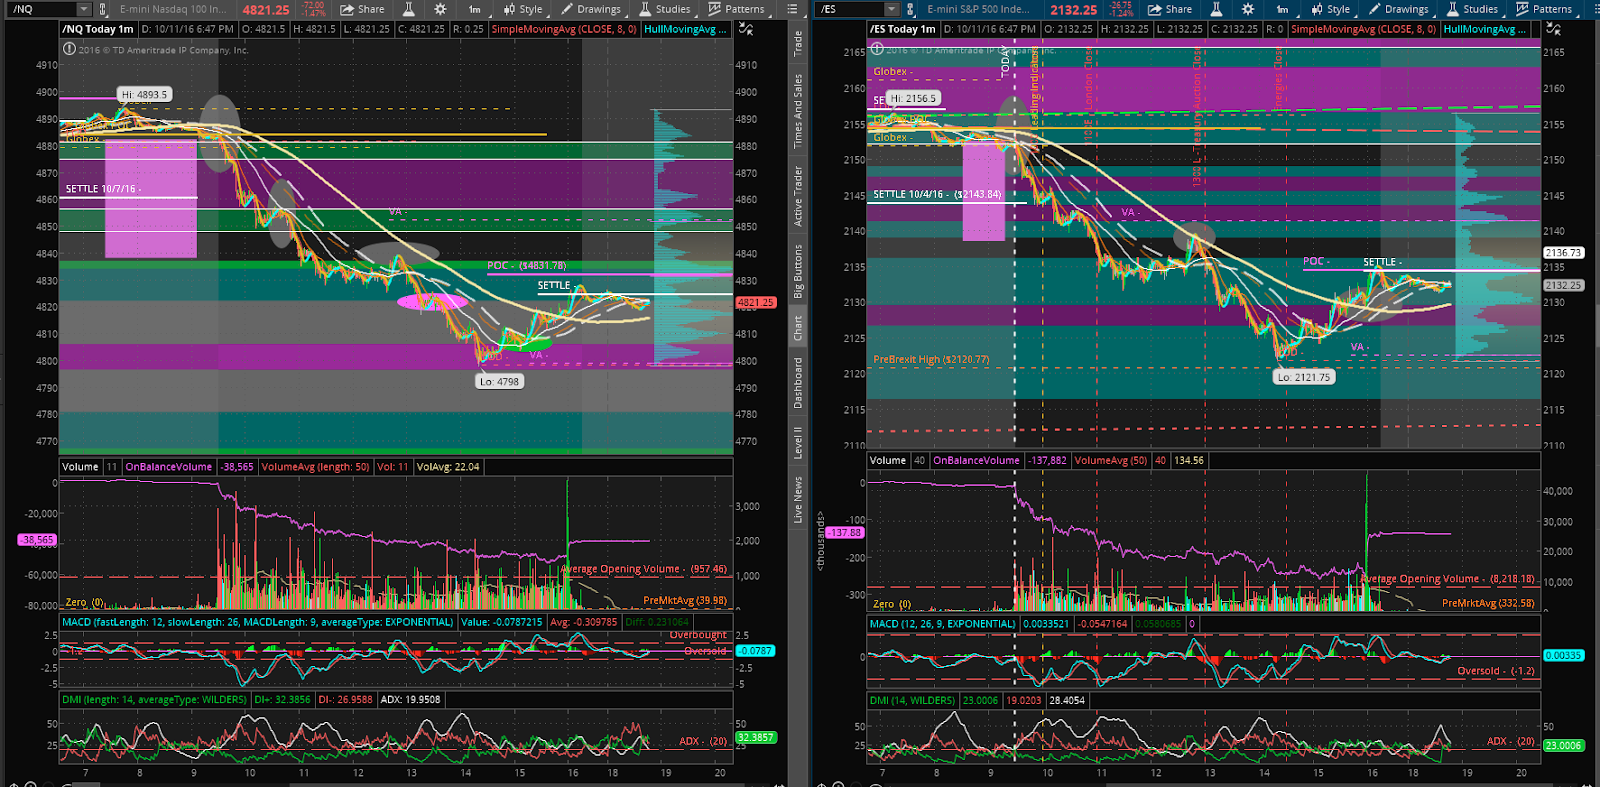
The final settling range for the day makes a lot of sense.  Zoom in inspection finds the settling price on top over recent levels (i.e. Globex POC, prior day Value Area edges, Pivot Levels, R1 level (ES),  HVA edges, and a long term major trend line on the ES to boot.   I would guess that all of the operators, with so many visual levels around them, are jammed up in the city - It will take some long term money to march out of this jungle we are in…

Once all the bus drivers arrived at the final parking spot, reasonable volume was traded yet price didn’t go anywhere for the rest of the day.

Despite the sharp selling tails and the three day frames lower, I’m going to say that with the holiday next Monday and the Presidential debates the night prior, price is simply cementing itself into place for either way the tides turn and with that, work on my scalping - Having said that, anything goes…..

Dart Board Time


So, for next week.....

If I were an NQ operator, Today and this month, I've essentially gone nowhere, yet made a lot of money buy accumulating, marking down, liquidating, marking up, distributing, and going home (see price action above).

On the horizon (next week)

I’ve already shown reluctance to explore white space further but spent since September 21st building in a nice body of volume matching the body of volume beneath the 90 day HVA for this contract.   I’ve demonstrated consistent support at 4840 and got a Fib level there to boot....

If there’s reason to go short, there are well defined distributions below and even the Z16 contract low.

If there’s reason to go long, exploring further long using fib and pivot resistance levels would be good guides.

If I’ve nowhere to go, then filling in the Low Volume Areas would be suitable busy work  

Either way, I’d continue to doing what I’m doing here now, selling at the top as shown by the purple On Balance Volume plot descending, selling to anybody willing to buy.

Unless something happens...
The NQ Dartboard...


If I were an ES operator, I’ve killed time since July with two rectangle patterns, a wedge , each of these three time killers about a month long -- and now running out of time with that.   And the world still doesn’t know what to do...

The time up in white space was without strong buying volume and around September 4th & 5th with peak buying, it appears we packed up and retreated in time for the Z16 contract.

The ES Dartboard
While in the new contract, I’m continuing to take money off the table as shown by the declining On Balance Volume Slope.   

A visit to the Commitment of Traders report (www.barcharts.com) tells me that the large speculators are getting out while the small speculators and commercial dealers are buying.   Smart money always said go with the big guy.  That also tells me for intra day trading, start watching the commercial dealers flip product despite going nowhere.
Commitment of Traders, from www.barcharts.com


What to do next week?   The same thing I’ve done the last few weeks, take product off the table and make money moving price up and down while going nowhere - Unless something happens...

Thursday, October 6, 2016

Calm Before Hurricane Matthew or What's the Jobs Number?

he calm before the storm….   Hurricane Matthew is to hit Florida and the jobs number is due out tomorrow at 0830 (opening bell).   In preparation for the upcoming mess, there was only one recognizable campaign in the morning today where large lot selling was observed against defined HVA support.

Then, at 11:00, a one day reversal was executed driving price perfectly to defined support levels and rallying directly opposite of the opening where prices essentially stopped for the day resulting in a bimodal day.   This move is indicative of price clearly the ledger getting reading to move (somewhere)

The trigger on this move was purely volume with price action tagging along for the ride - If this is the way things are becoming, it will be time to break out my robot trading programs…   I took time this slow day to better try showing the large lot trading.   Hope it helps….


Inspection of the market profiles shows better the bimodal distribution and while the day did show some initiating activity compared to yesterday, it was still inside the second day prior meaning, we are going nowhere…


Because tomorrow’s jobs numbers is the excuse for the lame price action lately, a step higher is in order in the event the market does decide to move.  The NQ has been boxed in a rectangle pattern and the ES appears to be fixing to get squeezed out of it’s apex.   

While taking time to track some distant price targets for tomorrow,  I came to realize my new bain, disagreement of MP data between Bluewater and ThinkorSwim.   Linda Bradford Raschke had mentioned this would likely  happen and now it’s time to deal with it.   I’m believe my preference is to lean towards the ToS MP soon on the assumption that a larger population of traders use ToS than Trading Advantage.   Shame as the latter can really help tell the story…  

Finally, on a side note, it’s interesting seeing the OBV for the ES continuing to decline, investors are selling yet price continues to float.


Here is the Blue Water MP, also for a 90 Day look back…   Similar yet with differences which I believe is due to their scaling code to squeeze unbounded volume data into a fixed display window.   This is annoying as many of my trade triggers rely on reliable HVA definition.


Rundown:

Volume for both markets was lighter than average and with value essentially unchanged, this amounts to simply waiting for the storm... Hindsight shows a CLEAR reversal pattern on the NQ. The price was ripping down at such speed, it raised question on taking it but did yield good money.


Targets for tomorrow. - I've no idea what the market will do with the the labor number, with the hurricane, with global banks in arrears, with the election. Volume has been diminishing and the ranges tightening typically meaning it's time to move. Who knows where and how orderly will it be... Get up early and watch for elephants.... Nonetheless.....

If NQ breaks above ATH and into white space, go with the Pivot and Fib levels on TOS.  If price falls, week defined support levels.


The ES if further away from white space.   A break out in either direction and we’ll pay attention to our defined support/resistance levels