Friday, September 16, 2016

20160916 - Friday Morning Assessment

OVERNIGHT ASSESSMENT
Overnight is in balance and trading close to yesterday’s settle - No Change.


AAPL is the rave with it’s new iPhone causing the NQ to jump out of synch higher compared to the ES.  Still, there remains a LVA the could be filled.   The ES, for balance purposes, could handle rallying one HVA higher.   


Next week is FOMC.   Thinking today will be the last day to  position in anticipation of any Fed action.


Looking at the new sceens:
Everything was quiet until Hong Kong closed.   ES migrating lower into yesterday’s value while NQ is being supported by the gap/LVA that needs filling.  This gap/LVA is 70 points across, a considerable and tradeable span. The ES has an LVA slightly above.   This makes for mixed movement...

Another scenario is that the ES continues to fill in the next level higher and the NQ (thanks to AAPL) creates all time highs. This would allow both markets to move somewhat in synch. Wouldn't that be fun!.


Prior Day Trend entering Today  - Rally in the afternoon, ended with a buying climax - Flat into the close
Multiple day look back necessary? - Yes, ES still in week long auction region. Watch for visual levels
  • -- Asian Profile - P
  • -- European Profiie - b


  • G. OVERNIGHT INVENTORY  from yesterday’s settle:is ___ Long ___ Short __x_ Neutral Approx 65%


  • H. ARE WE GOING TO OPEN IN OR OUT OF BALANCE AND TO WHAT DEGREE?
  • _x__ In ___ Out ___ Near extreme of balance


CARRY OVER CONCLUSIONS

Last Friday and Monday provided good rollover action.   This week was spent filling the span.   Today, there is some slight span remaining to be filled on the ES.   NQ appears to have moved high based on AAPL.   This creates an inbalance as the two markets are now out of synch - Gotta see how this pans out...


Next week is FOMC week - Get ready to hunker down..

This morning, we start with the In Balance Rules....

Thursday, September 15, 2016

20160915 - Thursday Post Day Review

MENTAL STATE: I woke up waaaay too early this morning and got busy making chart fixes based on ideas from Charlie Lewis’s Currency class.   Was not in the right frame of mind this morning and did not become grounded until later in the day.   Nonetheless, I got lots of useful work done.


MONTHLY: Despite this present pullback we are in, the monthly trend long is intact..  Note how the NQ was late joining this recent rally (poor FANG news this recent spring) and now seems to be catching up.


WEEKLY: Close examination shows despite pullback, only the ES rotated short.  ES and YM appearing to bounce off SMA 20 (orange) and NQ bounces midair.  
DAILY - Pullback run is intact for ES and YM.  NQ has triggered a daily rotation long  This phase shift will create some interesting trading in the weeks ahead as the ES & NQ will be negotiating different MP formations with different S/R levels.


MP View - I am starting to use the 5 day MP along with the longer term MP….. The 270 day look back MP shows that the ES and NQ are structurally in two different locations.   This will make confluence a bit more challenging and will have to rely more on trading what’s in front of the individual chart.


The 5 day MP is a recent thing I’ve come up with on the Thinkorswim platform for tactical use.   Within a single day, the profile can be affected considerably so it will be important to draw these before the session starts.   I selected 5 days on the notion that Long Term Money campaigns will require more than a day to complete.  I may reserve the right later to use 10 day or 20 day MP composites (1, 2 or three weeks) depending on how the auction/price action appears to be shaping up and will annotate the differing time frames in the discussions.  


What I like is how much quicker I can come up with these MP perspectives depending on the need through the course of the trading session to better spot targets & confluence of support & resistance.


Also, you can see where I’ve added vertical time lines specifying key events throughout the day.  This was a charting idea that came from Charlie Lewis and while it may added some pre session work updating these key time events, I like the idea of having everything in front of me.


On the above chart for the ES, the MP is admittedly blurred ast price filled in between the two HVAs.   This single chart down shot me that price rallied today and settled on a POC from three nights ago confirming that this rollover Zig/Zag is a large scale and well thought out event.   Inspection shows considerable volume file is needed between today’s settle and the gap fill from last Friday.


In the above chart for the NQ, we can see how the NQ has jumped the gap from last Friday which is nice but has leve a ditch of low volume between 4760 and 4790 - Which to me is an area where the NQ might loiter tomorrow while waiting for the ES to catch up?

YESTERDAY'S Price Action:  The prior two charts may become my charts for reviewing price action in the future.   They address the following topics and require less amplifications.


  • VOLUME - NQ & ES Volume was steady at 135 - 140% of average  BUT lower than yesterday


  • POSITION/STRUCTURE - One thing to add was that the distributions today were long and spindly, a sign of short term money fixing prior anomalies left behind.


  • Runaway / Excess / Spikes - Will we liquidate one more time to rescue the prior globex low prices?   That remains a question for the days/weeks ahead/


  • Key levels reached - As mentioned, the NQ has closed it’s Friday gap and within striking range at it’s all time high.  I do not believe (despite recent success of AAPL) that we’re ready to accept prices up this high as we’ve still some LVAs needing to be filled with cement.    My hunch for the ES is that the range from 2137 to 2156 will need some filling also.


  • Pivots / Charlie’s Charts - Coming Together
  • WHERE IS THE COMPOSITE POC? - Above and below us
  • MP POC/VA/LOD/LOD Feature relationships (higher, lower?) - All around us….


  • TEMPO - A stop killer, short in the hole squeeze  kind of grind all day.


  • Has one time framing failed?  Not sure how to declare this.


  • Rotation / One day reversal / Key reversal Day - Target destination at other end of range - Both ES and NQ appear to have reached the opposite ends so I believe this valied.


  • End-of-day trend (last hour) tends to continue into the first 10 minutes of the next trading day (?). - I’m still not sure if I believe this.  Today, we rallied all day.   That would mean tomorrow, we see a brief  rally out of the gate.   To be determined….

  • Directional Preference - Higher values on less volume => Uncleaar

PRIOR DAY TRADE REVIEW:

Trade review - In days before when volume was light, the SMA bounces would agree which I would use as a qualifier.   Inspection finds that with high volume (approximate 146%, the SMA bounces are a bit different.   I need to get comfortable with this.


In the afternoon, we had some continuing range extension so I got in with a slo mo.
Also see the missed SMA bounce in the ES


END OF DAY CARRYOVER SUMMARY:   


The strong volume at the opening bell went to simply fill the sink hole of low volume which I believe was by design.   The initial balance move was not recognized when it happened as the higher volume caused a non confluence of SMAs entry qualifiers.


By definition, we have an uncertain market biding time filling up the LVA.   

In the mean time, I’ve spent effort to further simplify and reduce confusion.   We will see what the overnight brings…..

Monday, September 12, 2016

20160912 Monday Post Day Review

20160912 Monday Post Day review (Setup for: 20160913 - Tuesday)


MENTAL STATE: Today was the first official day of Z16.  I waited all day for the tech support call that never happened.  In the meantime, kept myself busy yet annoyed.


MONTHLY: <defined long>
Last Friday’s rollover pullback could not put a dent into the monthly timeframe rally


WEEKLY <defined “on-the-line”>
Friday’s rotation that crushed the trend has borderlined the Parabolic SAR trip points.  Pullbacks were awfully close to half back.   Maybe time to project extension?


DAILY <defined short>
Thanks to last Friday, we have rotated and theoretically going short.   
However, we appear to be bouncing long off  SMA 80 & 100 on the ES and NQ
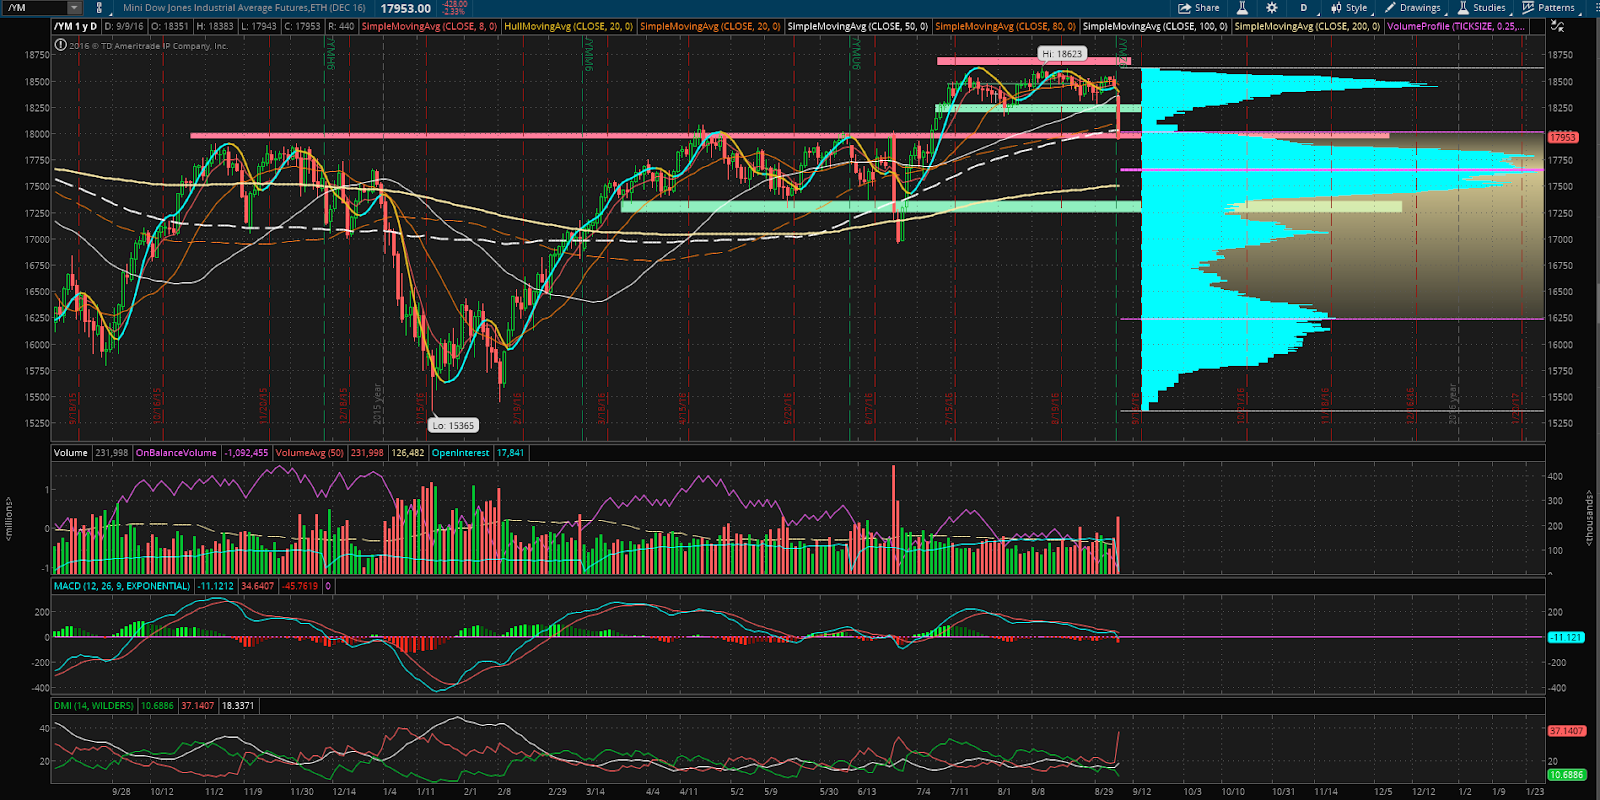
The YM might be possibly bouncing off SMA 50
Coincidentally, observe fib levels for grins….


YESTERDAY'S Price Action:
The first official day of the new contract.
Note to self - Start paying better attention for opportunities during the four roll overs.
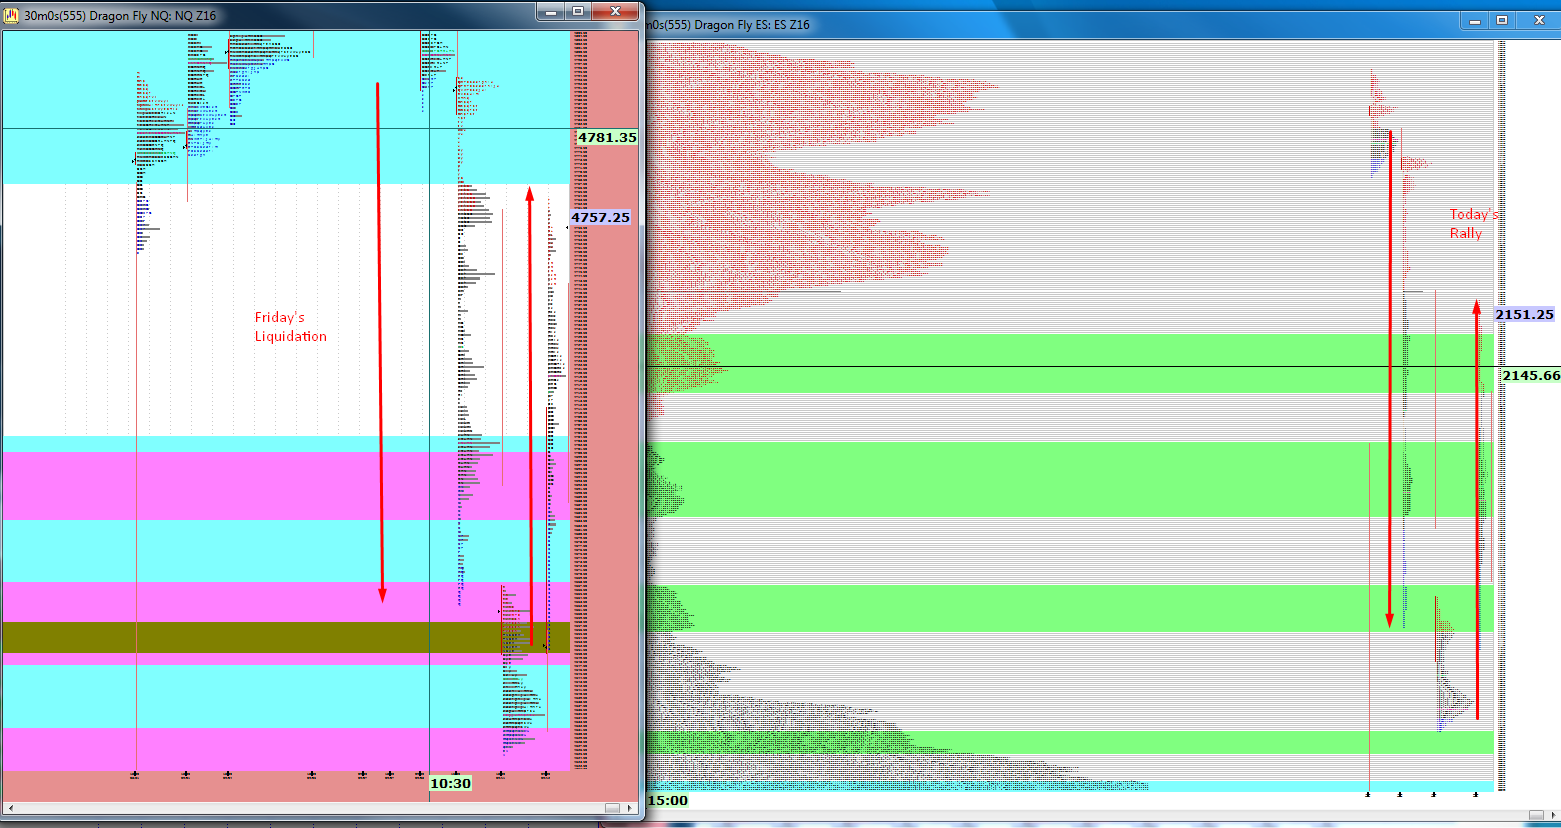
I believe I would call Friday and today an combined two-day reversal / a zig-zag combo


VOLUME - impressive
Overnight volume was 230%, Daily volume was 180%


POSITION/STRUCTURE


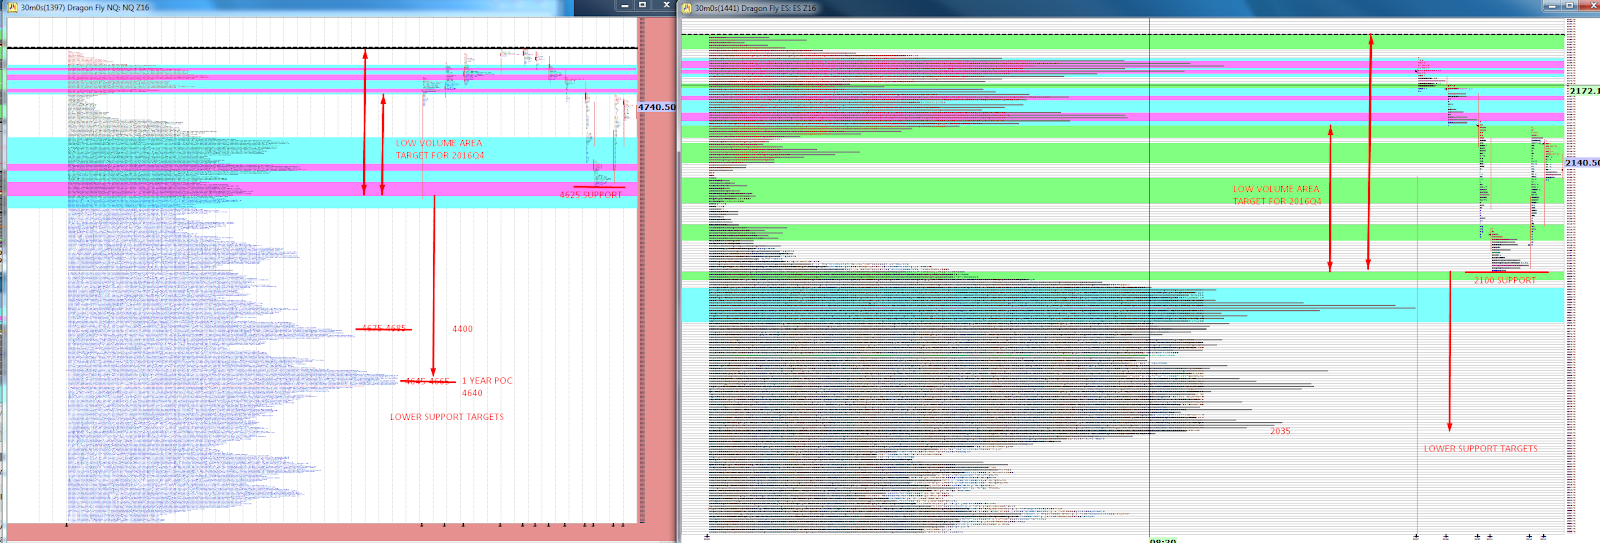
In my opinion, this was a very well behaved price move.  Price range was clearly observed to span between the recent all time high for resistance and support at the levels demonstrated over the past year (the highs pre China Meltdown about a year ago, the highs pre 2016Q1 Correction about 3 quarters ago, and the highs pre BREXIT controlled  touch & go about 1 quarter ago)


What this means to me is that we’ve a pretty well defined contract range to operate within for the next quarter.   I also understand that while the market priced in Clinton as a president, the market does not know yet how to price in Trump as a President.   I can’t do anything about this so will merely muse on this in the months ahead.


Runaway / Excess / Spikes - Close examination will find very very strong Buying tails in the NQ & ES at the opening.   To me this means we are through doing business down at these session low levels on less something very bad happens. On a side note, the speed which this tail was put in, to me, is a sign of a short covering rally.


Key levels reached - During the globex, the low was an even 2100 which would have made for a very nice entry point to buy long.   The turnaround point was 4625 which was not as fancy of a number.  Both globex markets turned around at composite HVA’s….   


Today’s highs


Today’s lows


TEMPO - Methodical throughout the day.  A bus driver was clearly in control


Rotation / One day reversal / Key reversal Day - Depending how one interprets this, we could be heading for all time highs now that we’ve gotten this zig/zag out of the way, Or we may simply mull here for a few months.   We’ll see….


End-of-day trend (last hour) tends to continue into the first 10 minutes of the next trading day (?) - I’m still having trouble believing this one.  It appears as if price achieved its mission by 14:35 and simply sat for the rest of the day for everybody to catch up.  I won’t be watching for this tomorrow.

PRIOR DAY TRADE REVIEW:


THE TECH SUPPORT CALL LAST FRIDAY NEVER HAPPENED - I STOOD BY TODAY WAITING FOR THE CALL AND OF COURSE IT DIDN’T HAPPEN.   TOOK THE FOLLOWING ON SIM WHILE WAITING.   NEED TO REVIEW MY NO-TRADE RULE.


INITIAL BALANCE TRADE - THIS ONE WAS ODD AND FOR THE SECOND DAY IN A ROW, THE MOVE BEGAN DURING PREMARKET AT 0744, 45 MINUTES BEFORE THE OPEN.   LOOKING CLOSELY, THERE “WAS” AN HONEST SMA BOUNCE FOR ENTRIES RIGHT ON THE BELL.     LATER THAT DAY, THERE WAS ALSO ANOTHER HONEST SMA BOUND - TWO ENTRIES TODAY.


ON THE EXPERIMENTAL FRONT, WE OBVIOUSLY HAD SOME ONE TIME FRAMING ACTION AND AN 80% RULE SETUP.   THE PULLBACKS WOULD’VE DRIVEN THE SCALPING STOPS BERZERK WHILE POSITION STRUCTURE STOPS FARED BETTER.


Summary:
This contract rollover was interesting - During this time, I was able to observe similar price action not only in the equities but also in the 30 year bonds and gold - something I had not expected.


Based on Friday’s price action.  I over assessed the possibility of the markets continuing to go short which clearly did not happen today.   A contract high/low span for the ES & NQ (56 & 138 points respectively) was established over the last two days.  The span between the contract low and all time high is an additional 30 & 80 points respectively resulting in a field of about 90 & 220 points respectively for the ES and NQ.  This should keep us in action for 4Q2016 while the global banks and the elections work themselves through.


Tomorrow, Charlie Evans is having an open class that starts at 0700 - I need to start getting up earlier anyway.

OVERNIGHT ASSESSMENT
Quiet responsive night from yesterday’s controlled rally.

The MPs suggest the trading range for the upcoming quarter, likely the LVA we are presently in bounded by the contract extremes so far.  Breaking below 2100 and 4625, we’ve identified our targets (update this into the cheat sheets)


The overnight inventory is in balance (towards yesterday’s highs),  For the time being, I believe we will open in-balance and so the balance puke pit rules apply.

  • Generate Targets for next day (TOS chart)


CARRY OVER CONCLUSIONS


Resulting from the recent contract rollover and MP examination suggests the trading range for the upcoming quarter, likely the LVA we are presently in bounded by the contract extremes so far.  Breaking below 2100 and 4625, we’ve identified our targets (update this into the cheat sheets)

Today, I will be monitoring the pit session but also in Charlie Lewis's classroom.


MOVE OF THE DAY  

  • Today, use the in-balance rules

Rollover, Z16

Migrating Elephants - Contract Rollover

A few years ago, Chris Mullaney explained to the room about a group of pit traders that would show up around contract roll over time and perform what Chris would refer to as Contract Spread Treading - Transferring positions from the contract soon to expire and into the next.  Chris would go on to say that these Spread Traders would cause the market to make all sorts of zany moves through out the day that often wouldn't make sense (I assume making sense for the established pit trader).   I asked my instructor Dan about these Spread Traders during rollover and from what I understand, with the shift towards around the clock electronic trading, Spread Trading between the two contracts takes place continually these days (as opposed to the transition period Chris was referring to back in the days of the Pit).  Before this enlightenment, I had thought contract rollover was simply a formality of updating our trading platforms...

One thing I observed was around rollover, the market would have daily ranges waaaaay beyond the average which would reckon being the longer term traders covering their range they wish to maintain.   For a day trader, we like extended daily ranges....

Several have written about when longer term traders show up in the room (Dalton, Williams, et.al).   They trade in huge lot sizes, they are serious about moving from one price location to another and they can care less on who they step on along the way.    These elephants often ignore visual indicators  laid out with such care by the short term brokerage houses (such as globex high/lows, value areas) and instead tend to migrate across the plains to a location usually traded way back earlier in the quarter that hadn't been visited in a couple moons.   As a trader, I've set up volume filters that start chirping when large lot sizes start appearing, that the elephants have arrived.

Friday, we clearly had a day when the elephants (long term traders) showed up and marched prices waaaaaay down back to prices that hadn't been seen for months.   This morning, price made one quick visit down low during the premarket before its slow march back up to last Thursday's value.    This was a perfect buying dip assuming there were some equities of value worth buying.


Also see Triple Witching, Quadruple Witching....

"Rollover day is when we switch from trading the contract that will expire this quarter to the contract that will expire the following quarter....  The futures contract that we focus on (the e-mini S&P500 or ES) expires on the third Friday of the months of March (H), June (M), September (U) and December (Z). The rollover days, however, are 8 days before expiration on the second Thursday of each of these months. These months have the letter designations H, M, U, and Z.

There are (allegedly) pit traders that just specialize in the days around rollover. They only trade these days (I have no idea what they do for the other 10 weeks in between rollovers but this is what I've been told) and they trade the widening spread in the expiring contracts. For whatever reason there are longer term traders that don't close out and roll their contracts at the optimum time. These rollover "specialists" will make a market (at a wider than normal spread) in the expiring contract and (apparently) make a very good living out of the rollover process." from Mypivots.com 


Sunday, September 11, 2016

Quarterly Synch

With the recent contract rollover from September to December, I thought it would be interesting to review a few charts for similarities/differences....


It appears that the Equities and the 30 year bonds are very synchronized in that we've a summer barnacle island of sorts along with a spring period base camp.  Much to my surprise, Gold also presented a similar summer/spring duality although the history of gold is much much different.

For grins I also laid out oil.


Gold is recently climbing with the equities...


Oil settling in it's new normal...