Summary
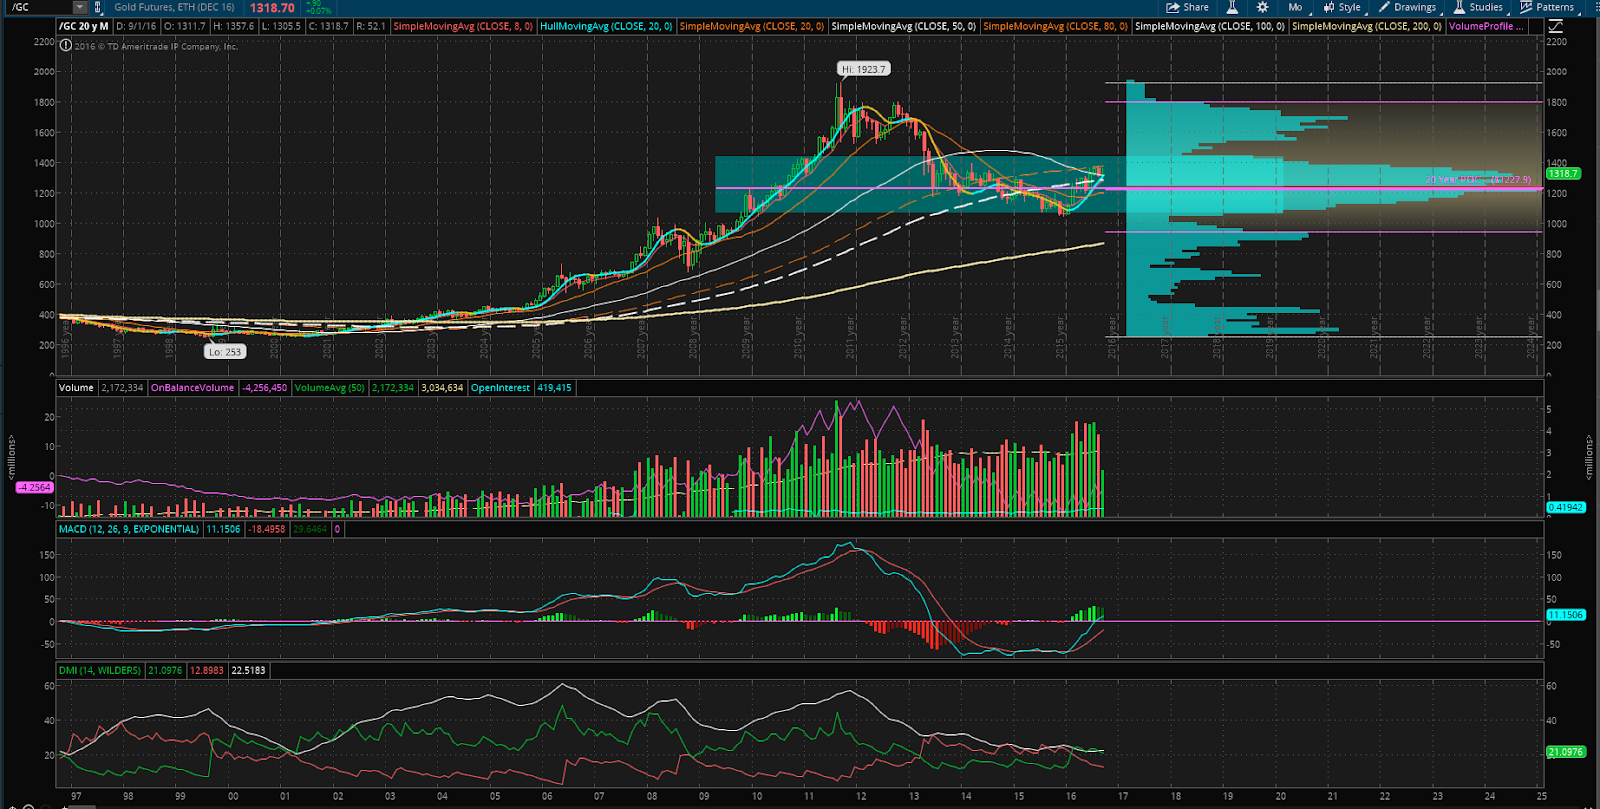
Oil has rotated long based on the Parabolic SAR, still well within its 20 year POC area. The news was that the oil reserved diminished by 1.18MBBL and that Libya and all of OPEC is ready for some kind of agreement.
Also, the Senate over rode the 9/11 Victims Lawsuit law 97-1 which might start making for emotional reactions in oil....

YESTERDAY'S Price Action:
Overnight volume was within very well defined visual levels.
Also today, Yellen got grilled pretty hard in from of Congress
Key Levels Reached:
The markets traded in popularly traded territory with many visual indicators to choose from. Of note:
ES globex closed a lingering gap mentioned yesterday leaving no remaining gaps.
ES LOD matched the Globex POC and the top of the 30 Day HVA edge
NQ LOD matched globex levels of the past two overnight sessions
The ES HOD matched the POC from -3 days
The ES HOD settled in between 2 of the 3 HVP in the ES Barnacle island
The NQ HOD matched the globex high, allowing the ES to catch up on position.
Volume: Mixed
NQ having 1% less daily volume than yesterday
ES had 15% more volume than yesterday
Most of which was traded beginning at 14:00 after all the other markets closed.
On balance Volume: Odd
NQ settled the day on net negative volume (makes sense as today and yesterday’s settle are adjacent)
ES settled the day at net even volume (very odd as today’s settle is ~7 pts above yesterday’s settle!!!!!)
End of Day Settle Volume - Appears to me that lots retail traders holding longs and liquidating cash close
ES Heavy Selling
NQ Heavy Selling
End of Day Trend: Began at 14:00 and went long
NQ rallied to globex high
ES LEAPFROGGED over morning session floor trader resistance and into the barnacle island (slick)
Today’s view:
shows stagnant opening.
Heavy liquidation began at 1000 Germany close which coincided with ES globex HOD/POC
Heavy liquidation began at 1000 when Yellen started getting grilled
A double bottom was put in at 1130 commencing the rotation from short to long
The NQ LOD coincided with globex low
The ES LOD coincided with 30 day HVA edge

5 day view is needed to show how prices levels matched came from several days back!
- Understand that the OBV indicator is now zeroed at five days back.
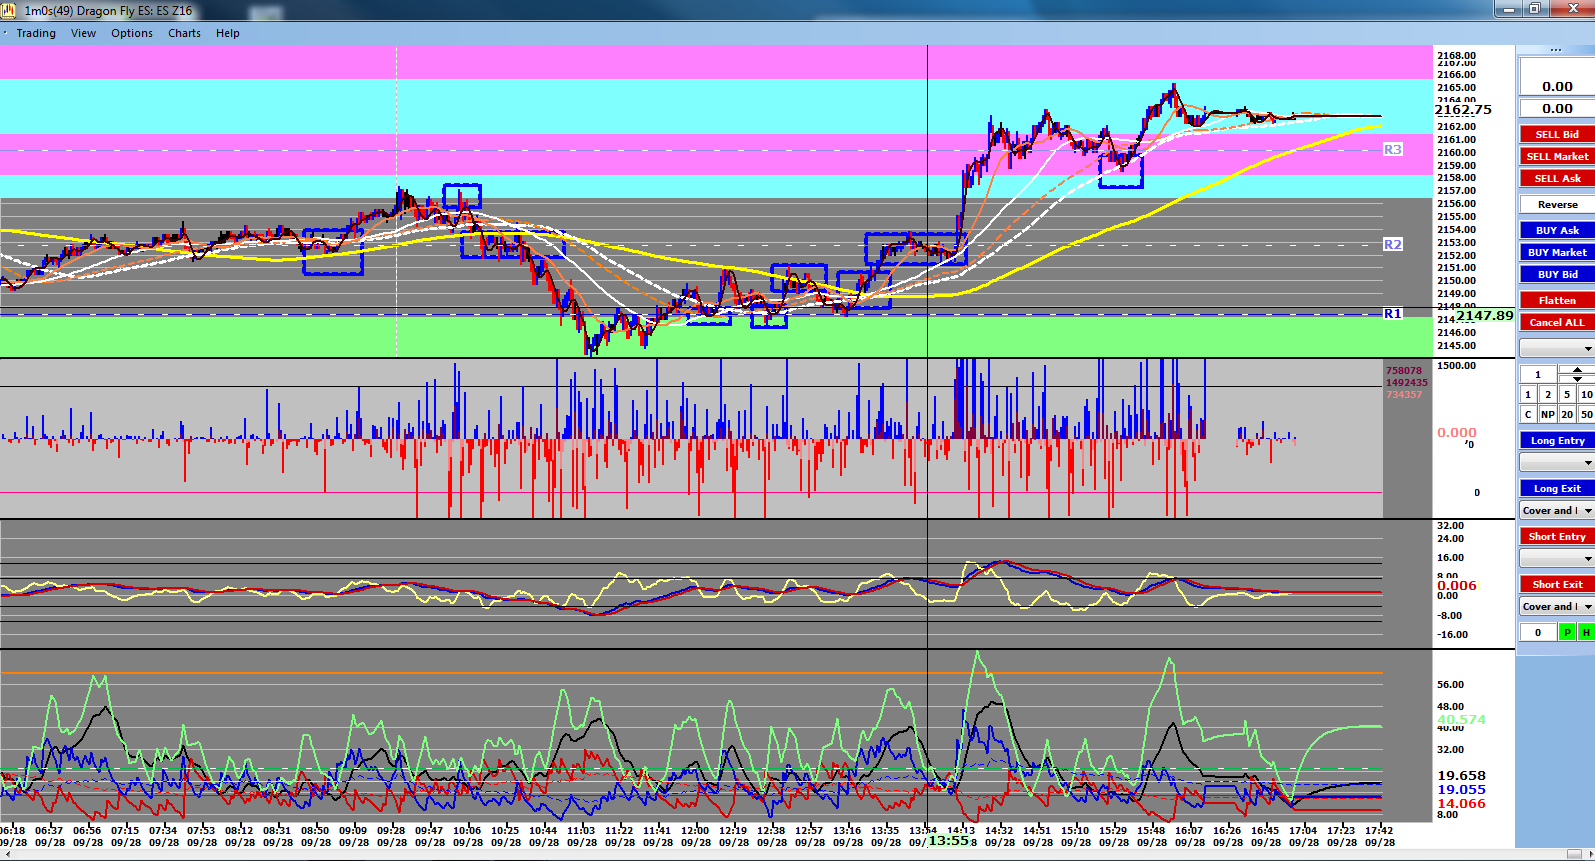
I’m showing this plot below because I’d like a better Institutional volume filter.
1400 - Large Elephants vaulted price above Floor Trader Resistance and into the Barnacle island
It is a bit hard to see but one in the Barnacle HVP, most of the buying came from retail buyers
- They took the market higher
- They had to liquidate at the cash close
- As they bought, you can barely see the large elephant sellers liquidating their positions to the retail buyers)
- The means to me that it will be soon time to go short as long term money is liquidating to retailers
- Interesting is how during the case close, there is a buying spike and not a selling spike

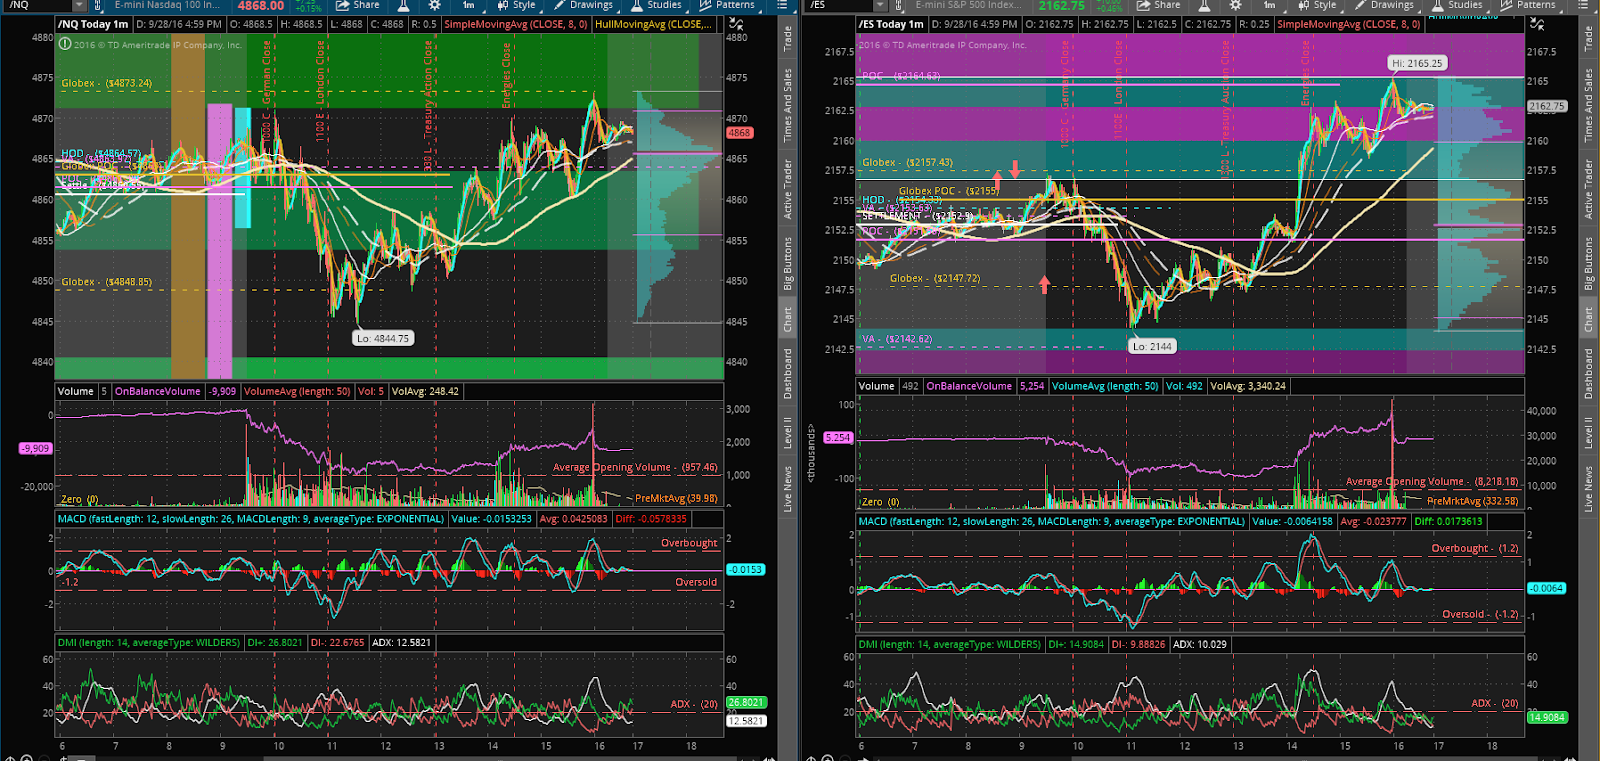
The NQ view is taken for comparison.
- At the 1400 point, a heavy buying rally took place
- NQ did not climb above Floor Trader resistance but into Floor Trader Resistance
- The liquidation of orders by large contract size traders is a bit harder to make out.
- TEMPO - The course of action following Yellen did not take place until 14:00, when heavy trading got underway
- MP STRUCTURE - ES has a multi distribution day. NQ has perhaps two distributions. Overall, we are well with the Barnacle Island Structure....
- One Time Framing - Mixed…. NQ traded within globex while ES framed longer
- End-of-day trend (last hour) tends to continue into the first 10 minutes of the next trading day (?). Use 5 minute view - By inspection, we had a rally meaning residual buy orders tomorrow morning
- Cash Out Direction - TOS shows liquidation at cash close while Bluewater Has buying spikes.
- Directional Preference: NQ is slowing down/consolidating ES is a mixed bag of strengthening buying based on even volume, a Moderately strong Day
PRIOR DAY TRADE REVIEW:
- Working on photos & Did not trade
END OF DAY CARRYOVER SUMMARY:
Despite the funny volume games, a trend is a trend until broken… Tomorrow, I’m expecting ES to reach the top of its Barnacle Island at 2185 and resynch with NQ.
If price files to advance higher, we could be putting in a complex top which would be unlikely with the easy money from the Feds.