A quiet week - The summer heat waves have finally subsided and thank goodness for the Andrew Smith dinner last night...
This is the 30th blog I've posted - Thanks for letting me do this as it has helped me tremendously bring order into the deluge of information I've taken in over the past year, where it became apparent that a QE bolstered market was a thing of the past and a better understanding was needed.
First, the usual run down, a trade review, and then some loose thoughts...
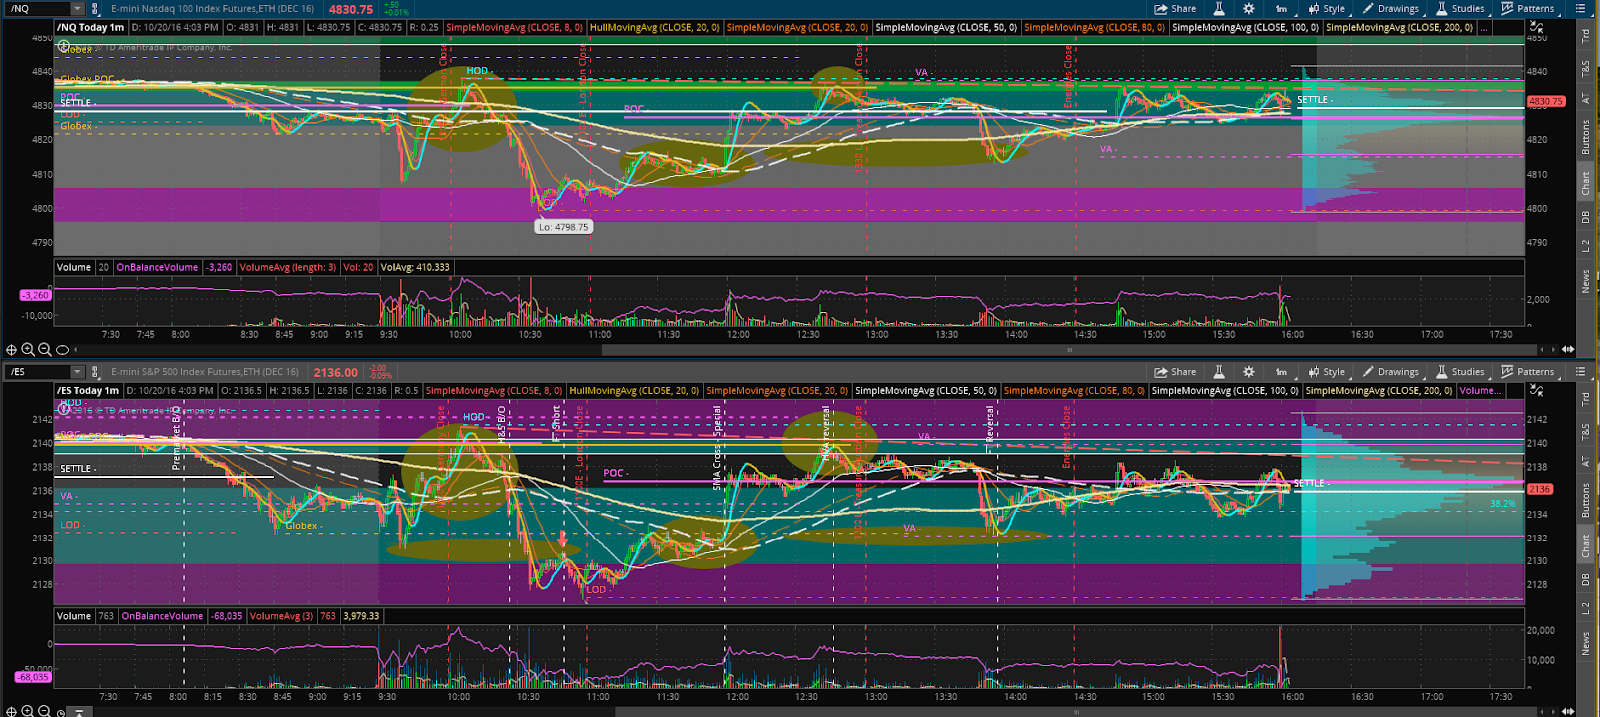
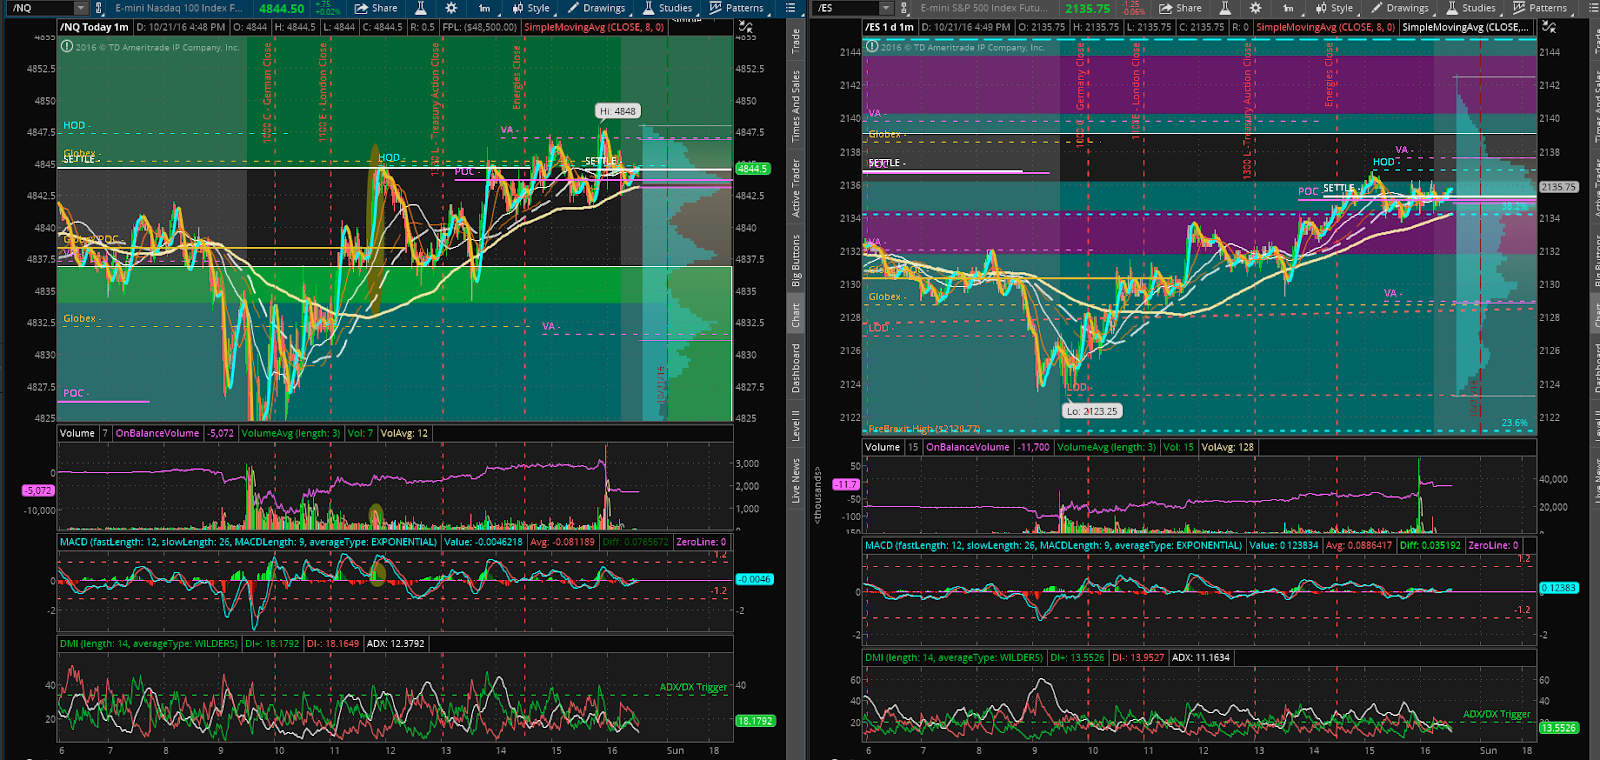
Big Picture - No Change. The three equities are filling in marked areas and proceeding with intraday in-balance trading rules. For the while, even oil appears to be settling. As I've become more efficient in the daily routine, I will start rotating in different charts of interest.


VOLUME ACTION
- Large lot buyers appeared today, unable to bring the round bottom up above horizontal support
- With all the large lot selling at the lows of the past two weeks, I’m again surprised price did not collapse, meaning to me a skilled operator is driving the bus.
- In the spirit of “no change” I would think whoever is buying all this inventory will be needing to mark up price soon
- I'm thinking for better legibility, discarding the ADX and MACD panels on this view.

STRUCTURAL ACTION
- Throughout the day, multiday lookback MP features played a part during today's live action. Seeing this play out over a period of hours helps make the day make sense
- Today’s ES pit was very responsive to the globex action (this is a recent change). This evidence supports the need to pay attention to the global playing field
- The NQ continued to fill in the identified LVA (as called)
- The ES continued to fill in the identified HVA (as called)
- This continues to be a sign of Short Term Money in charge of the market.
- What it will take to break out of this area, I’m suspecting it’ll have to be big news or the elections. (although I do have a theory in my mind that with all of the algos trading upon observable reference points, we may be having a dynamic damping of what used to be human driven action)

YESTERDAY'S Price Action:
Interesting - LOTS of visual levels near today’s settle.
After the morning test low, a single linear climb was observed all day
On Balance Volume indicates buying (for a change)
Afternoon Trend - Long, yet unable to gain high acceptance (for now)
Cash out: Mixed…. ES Short Cover, NQ Liquidation
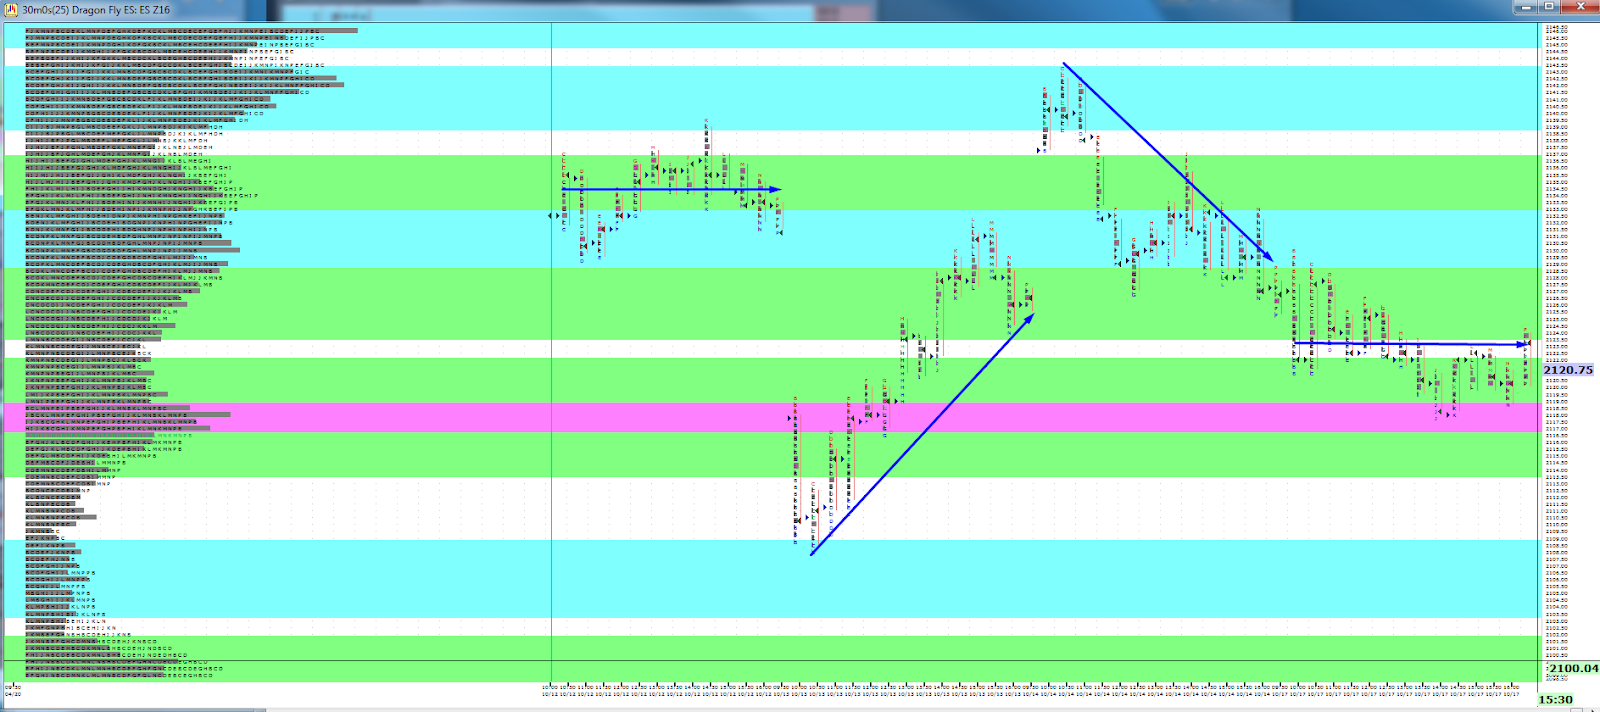
PRIOR DAY TRADE REVIEW:
0841 Premarket Position - Volume Wave Trigger.
0900 Premarket Position - Volume Wave Trigger
At first glance, both of the above entries would've required a bot to detect.
1027 RTM(20) - Somewhat risky as this was heading back into the open yet demonstrated a normal day distribution taking place over the entire day (and not just during the initial balance period)
1340 Retest and GapFill (flinched on a couple false entries wiped out morning profits) Observe how price didn’t cleanly bounce off SMA 200, rather, the prior day POC. I would call this a blown play that scored anyway.
 |
| Price action Trade Review. At the end of the day, several were able to trade off the HVA edge. |
 |
| False entries during the mid day rally - Sloppy alignments and trying to go long on the after lunch breakout wiped out morning profits, yet netted positive for the day. |
END OF DAY CARRYOVER SUMMARY:
- Afternoon trend was long suggesting long carry over
- If I were big money, next Monday, I'd have to decide if Im going to the level above or stay in the present level
- If I were the big money that bought all the large lot sales over the past two weeks, I am getting in need of marking price up for a profitable distribution.
- If I am big money that's been selling at these levels, I would not wish for price to go lower in order to sell at the best price I can.
- By Next Tuesday, a review of progress on the entire contract to see if a revisit lower is necessary
- If I am big money, I'm likely rotating my portfolio based on earnings reports as options expire today in a manner were even if the composite average does not move, my holdings will reflect earnings news and the upcoming elections.
Perhaps another week of musical chairs?