Sunday, December 10, 2017

XBT's First Four Hours


And it opened with a Bang....


UBIQ


Started accumulating UBIQ as a coat tailer to take advantage of lessons learned from Ether.

The deal is that it's in an accumulation pattern.

Quarterly interval cycles may be appearing

Recent rally appears to be BTC Coat tail driven

Demonstrated trend line support & demonstrated resistance @ $3 setting up a flat wedge long pattern.


Tuesday, March 28, 2017

Cognitive Dissonance in the Equities or Simply Out of Position


This week, I'm working on my monthly press cycle for a magazine I write for.   During weeks like this, I am often distracted and choose not to trade.   Nonetheless, I monitor the markets for things of interest.   Today, I spotted clearly what I had been suspecting for the past couple of weeks...

Since President Trumps speech to the Congress, the U.S. Equities markets have rallied into all time highs (white space) where the formation of market profile continents and island formations have been observed on clean canvas.

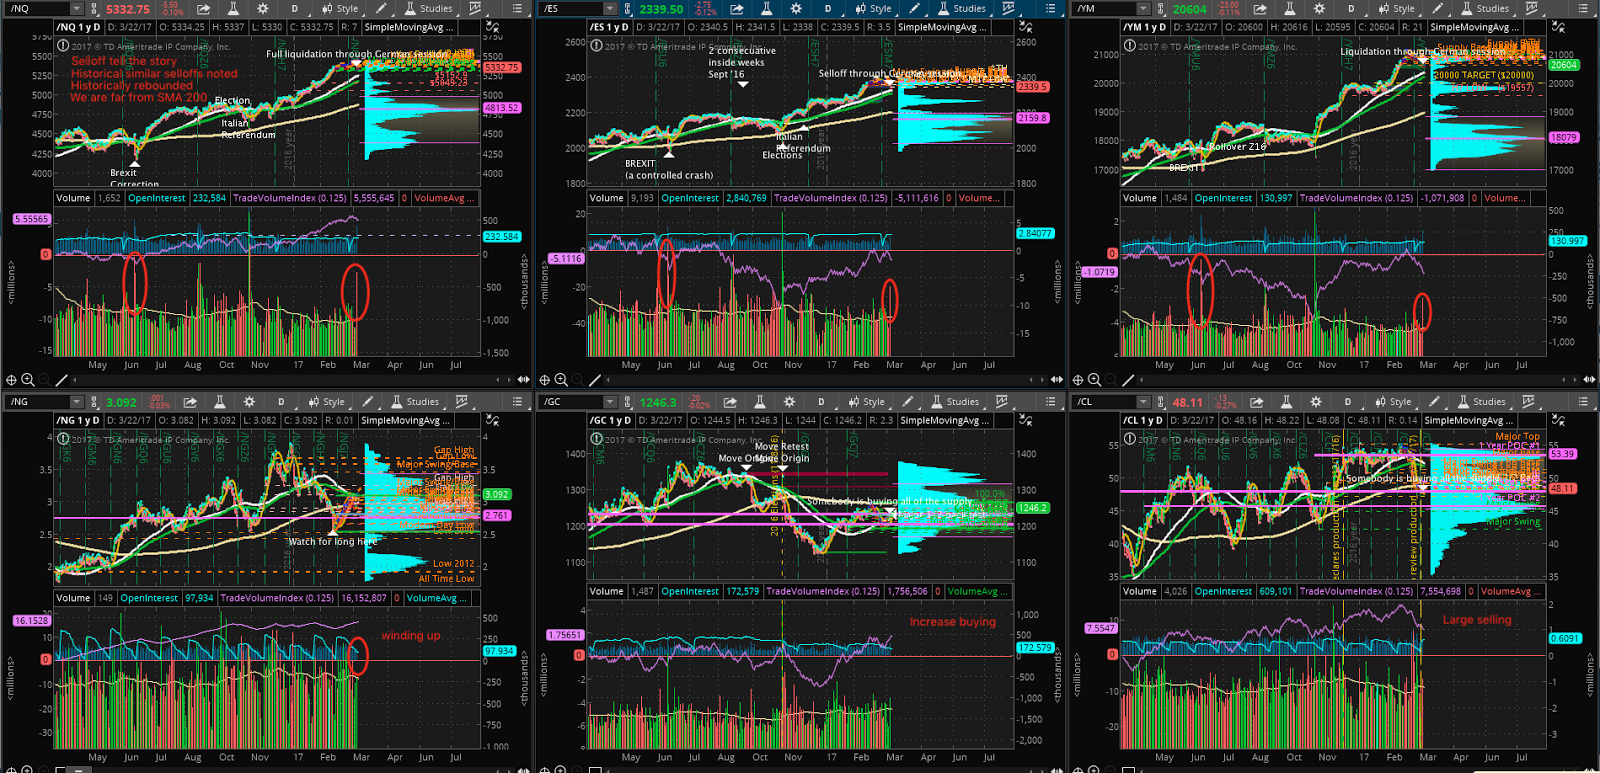
The equity markets include the ES, YM and NQ (S&P 500, Dow & Nasdaq E-Mini contracts).

1) J. Dalton teaches that markets which travel to precise visual locations (i.e. highs, lows, points of control, etc.) are typical of Short Time Frame traders in control.

2) Observations of the price action during the day finds Short Time Frame traders have been in frequent control during the past 20 days, with price action typically reacting to visual market profile structural features.

3) Price action amongst the three equities appears to be close to being similar.

4) Over the past 20 days:

4a) The NQ has formed a prominent continent and prominent island.   Today, price closed in the NQ island.

4b) The YM & ES has formed prominent continents, mediocre islands, and additionally reinforcing the composite market profile structure "south" of the 20 day Points of Control.  

4b1) This is so prevalent in the YM, that a case may be made that sellers are potentially short in the hole at present.

4b2) Presently, the ES is sitting in a Low Volume Area between the continent and the "southern" volume mass.

Given Item 3, that the price action appears to attempt to move in unison,  the situation has arisen where MP structural "road bumps" in one market will appear as "pauses" in other the other equity markets for what immediately appear to be as no good reason.

For the time being, while the three equity markets are highly correlated and until a Longer Time Frame trader steps in, it seems prudent for the while to monitor price action throughout the day of all three equities - Not simply trade what's in front of you but "what's in front of you".


In the charts below, note the
- Similar price action in the equities for the past 5-8 trading days (3)
- The similar/malformations of the 20 day composite Market Profile (4)
- Today's price with respect of the different MP terrains.
- Also seen the notes within each graphic.


Economic Indicators - Scoreboard


According to textbook interpretation, the economy is looking good sans labor and valuations....


M17 Bottom & Brick Walls


- Breather before resumption of the NCAA March Madness

- Busy working on my column


Summary
  • Equities “appear” to have put in an M17 low
  • Longer time frame traders appeared today providing range extension (long) in equities
  • Equities are out of formation for a unified move (watch for fragmented moves)
  • Gold & Oil reacting off structural S/R failing to penetrate further

Ruling Reason

  • Assume continued consolidation (intraday & initial balance development trading)
  • Watch for natural b/os


Monday, March 27, 2017

March Madness Breather 2017


Been spending time with a new chart arrangement to better allow me to follow multiple markets over multiple time frames - It took awhile.    One of the nice things is that I can get to almost anywhere I desire in 2-3 clicks with a lot less panning and scrolling.  

This week is magazine month but need to get back into the habit of market study.

After the ridiculous rallies, the markets are taking a breather.   Serious barnacle island formations are needed as the market profile structure below us are rather "thin"

The three equities have "finally" completed retest of the 50% pullback with the NQ and ES having accomplished this last week - Today, the YM finally touched this support level and 'jumped" back higher into value.   This test was aided by the overnight selloff during the globex session which doesn't surprise me.


Oil is finding support around $47/barrel, a long time frame Low Volume Area, having tested the level about three times


Gold is at a key level, $1260 resistance, another longer time frame low volume area.


Ruling Reason:

We are at key make or break levels where the market either consolidates building support on fragile space, else we stand a chance for price drives to new locations for auctioning.

Continue day trading accordingly.


Friday, March 24, 2017

Reckoning Levels


Equities are consolidating at key swing levels - Either price holds here, else the escalator lower continues...


Gas appears to be putting in a top formation

Gold is trending higher and well into value (Zig/Zag overall)
 - Watch for overhead swing resistance

Oil has hit SMA 200 and in good position for technical bounce
- OPEC is meeting in May to reexamine production levels
 

Perform intraday trading accordingly

Tuesday, March 21, 2017

Pullback finally...

Summary:
- Equities broke lower today beyond the respective Average True Range
- The initial liquidation concluded coinciding with the German close before resuming
- The bottom reached were historical references


Long Term Trends
  • Tuesday equities sold off with the magnitude of Brexit but not to the SMA 200
  • Oil is long term selling off but holding at the SMA 200
  • Gold is buying and finding acceptance at long term POCs
  • Natural gas is buying & reaching chart resistance

Intermediate Term (4 hour)
  • Equities has reached chart level & psychological contract levels
  • Equities has met the 4 hour SMA 200
  • Equities has weak MP structure below
  • NG gas buying continues, reaching key chart level resistance
  • Gold breached above key Points of Control
  • Oil has reached key Pre OPEC agreement levels (prelude to upcoming OPEC meeting?)

Short Term Review
  • History suggests a rebound in the equities after today, however, the MP below is weak
  • Gold has broken above points of control. Looking long
  • Natural gas has been trending long but needs to break above chart resistance
  • Oil appears to be perfectly happy where it’s at.


Wednesday, March 15, 2017

6S 40 Month Cycles & Possible 6E Bottom


In recent months of incorporating supply/demand bases into the fold, it's been interesting watching these bases evolve into High Volume Prices, High Volume Area edges, and Points of Control - Interesting and distracting chart clutter.


While implementing a decluttered charting scheme I picked up from Bruce Erickson, I noticed an interesting 40 month cycle appearing with the Swiss Franc.


Another observation is either a possible bottom being put in on the 6E Euro or the establishment of a new channel formation.


Thursday, March 9, 2017

First Look at Currencies


Recently, I've taken to the Currency Futures as a form to practice a few techniques I've been acquiring.   Nice thing about the Currencies is that they're global so it's usually easy to find a market that's displaying activity.

It didn't take long to rediscover that without understanding proper context, trading results are haphazard at best - So early this morning, I began an exercise to better frame currencies.

This is a survey of currency markets from a large overview perspective.   Precious metals are included.

Summary:   Many instruments are either currently at or forming major points of control (fair value) and likely to remain that way until some event causes imbalance.   In getting here, the US dollar has increased in value by 20% in the last 3 years while the rest of the world tanked.

Values are rounded to the nearest US nickel for simplicity.


The US Dollar is rising, presently at 1.01 from 0.80 in 2014 (+20%)


Looking at Gold & Silver, we find these near their 20 year Points of Control.   These fair value levels appear very well defined:


Australian Dollar: After  a defined fair price of 1.05 in 2011, value has declined around 0.75 (-25%)


British Pound: Forming fair value around 1.25, a 37% falloff from 2007 highs (~2.00)


Canadian Dollar: Forming fair value around 0.75, a 25% falloff from 2007 highs (~1.00)


Eurodollar:  Was around 1.30 , now around 1.10 (-15%)


Japanese Yen: Settling between 0.0085-0.0097, after a 40% drop from 0.0128


Mexican Peso.   Falling like a brick from 0.08 to 0.05 (-38%)

Sunday, March 5, 2017

Start of Month Gold Review


On of the room's upper class man passed along a fibonacci worksheet and asked me where the price of gold was going to go.  Scott sort reminds me of Otter in Animal House, interestingly wise in his ways.  Spending the day off drawing fib levels, I've got to admit after awhile getting confused which way was up.   Nonetheless....


Gold has been moving nicely, inversely correlated with recent equity action.

In the long term, Gold has settled near its 20 year, 5 year, 1 year and 20 day point of control (meaning churn)

Recently demonstrated support levels at 1220  and signs of a short term long trend have been observed.

Short term trading respecting this rotational market appears wisest for now.

Intermediate and long term signals are mixed and will probably remain this way until some event takes place.   Details, observations & ruling reasons are on the pictures.


Long (monthly) View
- Price is at "fair value", awaiting a major event


Intermediate (daily) View
- Price is entering a squeeze at this multi time frame point of control
- Based on prior action at this level (from the other side), a pullback before continuation long?


Short Term (30 minute) View
- Until a major breakout signal is observed, trade the rotational market between visible levels


Saturday, March 4, 2017

February Wrap Up


This January & February was spent fine tuning loose concepts into practicable trading techniques and streamlining processes reducing the amount of time spent before, during and after each session to better focus on session activity - Spring Training...

The Plan of Day templates have been modularized and moved to a web based format. Cockpit layouts have been cleaned up for multi-market scanning, detailed focus study & trading. I'm still carrying two platforms, TA Trader as it has a very flexible Market Profile and Bid/Ask Delta modules while migrating further to the Think Or Swim Platform for the majority of charting duties.   Without getting into the nitty gritty details of technique, below is a fly over of t the new cockpit.


Multi-Market Scanning Screens w/ Sector & Market comparisons


Close Focus Screen


With time freed up, other laborious studies have been streamlined

- Streamlined Commitment of Traders Review 
-- (merged individual reviews into a consolidated single review session)


- Market Calendar Summary
-- Existing web based calendars were tabular and disjointed
-- Coherent hierarchy organization of A & B list items with other relevant data


Most important of all, I've restarted the scoreboard for trade accounting - With the margin account reloaded and February scrimmages,  going live this season is coming along...


To be continued...


Wednesday, February 22, 2017

Thursday Review

Summary:


  • (bull) ES presented an inside range day w/ higher POC
  • (bull) YM & NQ presented higher POC/LOD/HOD
  • (watch) GC is consolidating between demonstrated resistance and trendline long
  • (watch) NG is demonstrating a bottom and possible flip w/ new contract ahead
  • (watch) CL supported with a rising trendline, failed to break higher, and regrouping
  • (watch) CL is developing it's new contract with three initial High volume prices


Monday, February 20, 2017

Gold Review


Long Term Monthly Gold
- See illustrations
- We are packing it in pretty tight in the big picture
- Bearish SMA50 & VWAP
- Demonstrated support at 20 year value area bottom


Long Term Daily Gold
- We are in the vicinity of the 20, 5 & 1 year Points of Control
- Presently, we have resistance stemming from an October swing low
- Price appears to be "jamming" against this resistance level
- Targets identified if we break out long
- See illustration


Intermediate Term (4 hour) Gold
- Targets better identified if we breakout above last October's swing low
- We appear to possibly be putting in a top at last October's swing low.


Short Term Gold
- Watch for intraday trades accordingly