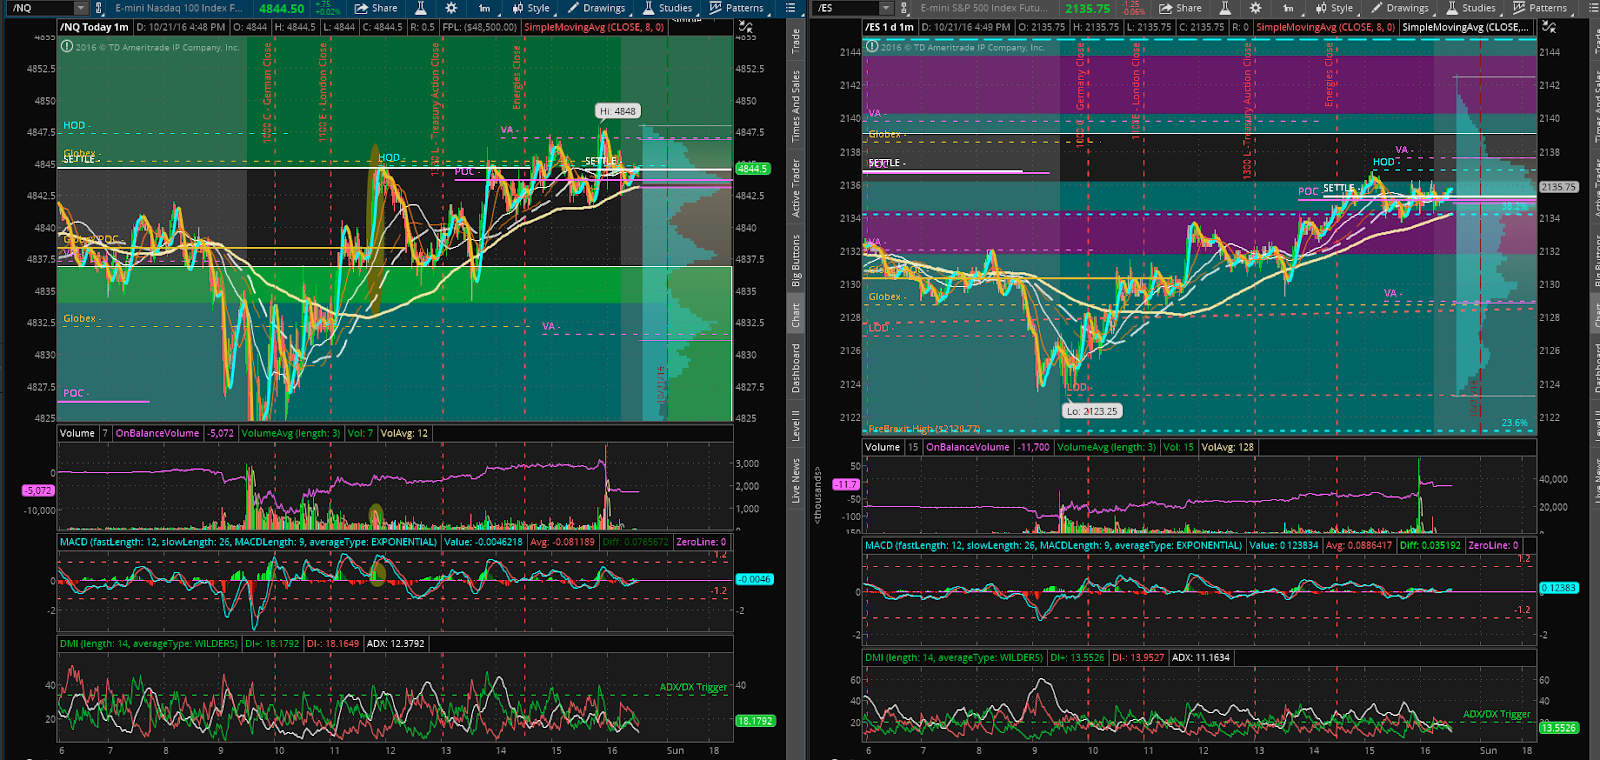
Thursday, October 27, 2016

More Earnings Reported, Price Stays in Accepted Ranges

2016-10-27

MP Action
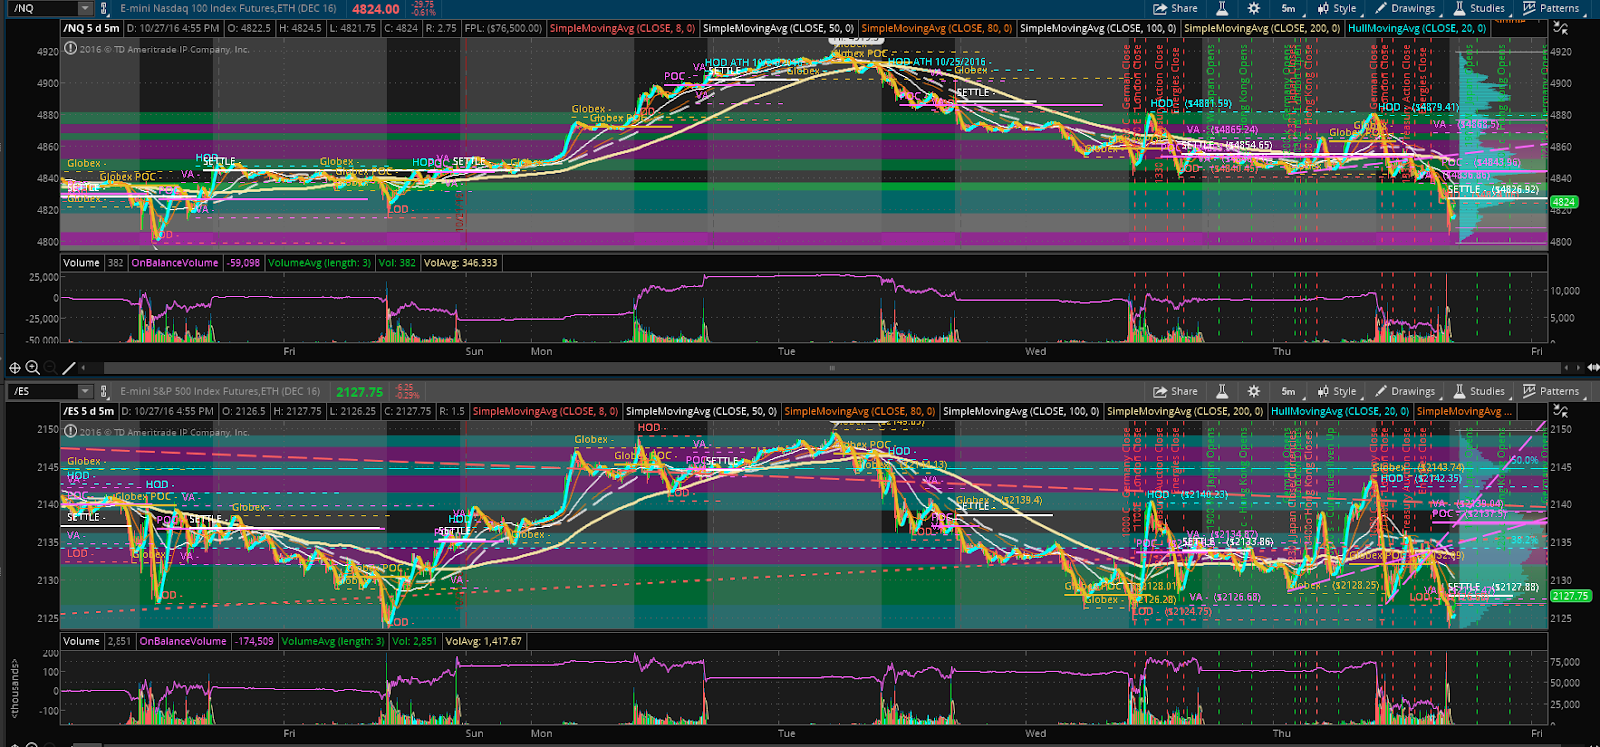
  • ES continued stair stepping lower
  • Enters a Buying tail at LOD matching Friday’s LOD
  • Next lower targets would be Z16 Rollover boundaries (Contract Low)
  • Anticipating (1) Final testing low and reverse long (2) Test Contract Low,


  • NQ matched yesterday’s HOD and marched to PIC (w/in defined HVA)
  • NQ broke below defined HVA down to next lower HVP (w/ Buying Tail at end of day)
  • NQ has reentered last weeks range


Price Action:
  • Great respect for defined HVA’s and visual chart features
  • MO matches that of recent  short term traders and long term traders


  • VOLUME ACTION
  • Large lot liquidation at session open,
  • accumulation mid day,
  • large lot liquidation at end of day
  • - More selling at end of day than beginning of day (selling spike???)


PRIOR DAY TRADE REVIEW:
  • Lots of movement but slow (the new order?)
0620 Price markup to prior day HOD
0900 Liquidation begins (gap close, inventory adjustment)
1000 ES & NQ RTM
1030 ES HVA reversal long (CT)
1215 HVA Reversal short
14:30 ES/NQ  SMA Cross, RTM confirmation & Yesterday’s LOD range extension (trend rules from here)
1510 NQ Slow Mo after range extension.
1541 ES & NQ SloMo (off HVA Edge)


END OF DAY CARRYOVER SUMMARY:   

  • End of day selling heavier than morning selling.
  • Expect residual sell orders next morning
  • Price, if accepted into last weeks range, requires lo0king back into next week
  • Typical cycle suggests long tomorrow, (earnings reports)
  • Amazon failed

Wednesday, October 26, 2016

Bridge the Gap Day......


We had a Zig-Zag day....

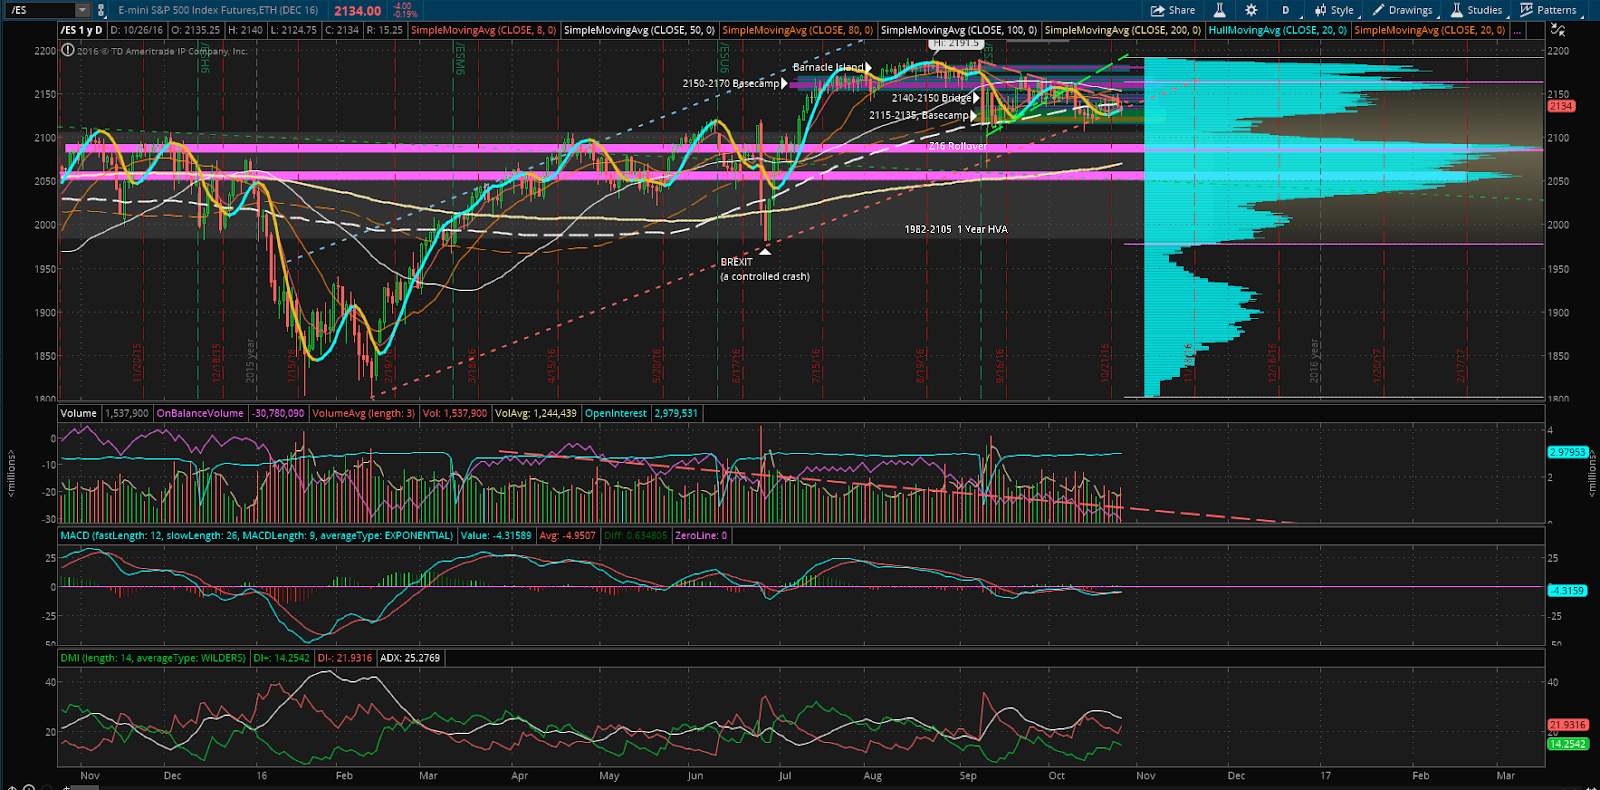
1 Year Overview ES
  • (Short) Predominate selling bars on the Volume Chart
  • (Short) Below SMA 20, 80 & 150
  • (Short) Price waaay above SMA 200
  • (Short) DX- dominate
  • (Short) Declining OBV
  • (Long) Riding a Major trend line
  • (Long) At the Bottom of a 1 year HVA edge
  • (Sideways) Strong LVAs at 2025 & 2050
  • (Soon) Price and apex of wedge
  • Summary: Continued intraday day trading


1 Year NQ
  • (Short) - Finishing a buying cycle on the dip (we are at the apex, see prior apex)
  • (Short)  Near All Time Highs
  • (Short) Weak trading volume when in shite space
  • (Long) Riding SMA 20 & 50
  • (Short( SMA 80, 150 & 200 are below
  • (Sideways) Pronounced OVAs at 4755 & 4885
  • (Long) - Major Trend direction
  • Summary: Continue intraday day trading
-


90 Day Overview
  • (long) NQ OBV is show buying increased buying
  • (consolidation) NQ is trading within HVA boundaries
  • (Consolidation) ES showing SMA coiling
  • (short) ES OBV is showing liquidation.
  • (consolidation) ES ADX is stuck


MP Action
  • ES closed at the Centroid.
  • ES Ventures into the two LVAs above complete
  • ES Price Today has ZigZagged
  • No gaps Outstanding
  • Summary: With zigzag complete, expect move out?


NQ - Price completed closing the gap
Price has conducted a zigzag pattern
Summary: Expect price to remain inside HVA


ES - Triple Distribution today


Volume Action
  • Mixed
  • Lots of large lot selling in ES
  • Lots of large lot buying in NQ


Price Action


PRIOR DAY TRADE REVIEW:

Worked on magazine today.   No trading….

0945 NQ Reversal Long
1100 ES London close RTM and oil news)
1310 ES Treasuries close breakout short
1330 ES & NQ RTM (w/ HVA)


Summary: to maintain three day trend, look short or within same area

I believe the operator for the last 3 week is where we are at, went lower, higher and now back.

Tuesday, October 25, 2016

Early voting week.....


YESTERDAY'S Price Action:
  • NQ has put in a 2-day round top and eded the day sitting on a gauntlet of support
  • ES continues to fill in the noted Low Volume Area.
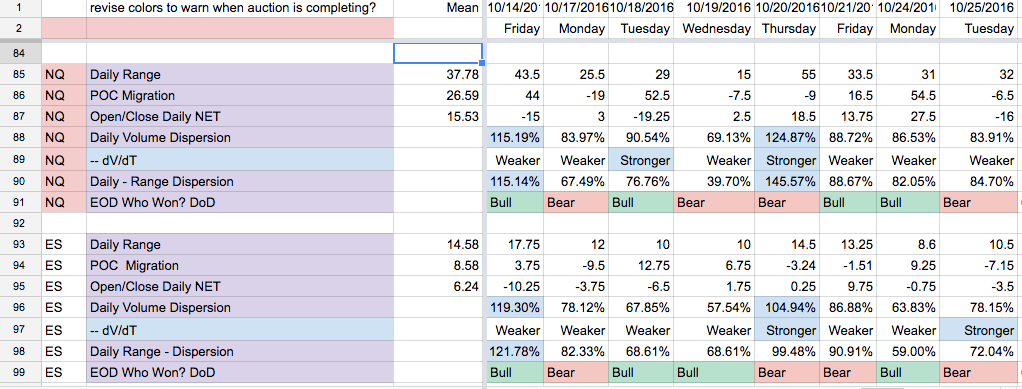
  • The daily range of both are between 15-25% below average (narrow trading day)


MP Action

  • Consistent with what we’ve been calling for over the past few days
  • ES is filling in LVA
  • NQ is creating a barnacle island


  • Also, the NQ gauntlet described prior appears to be holding as support in the NQ.
  • Also, remember the anomaly loaded MP structure back on 10/11 (clue - if we break convincingly into the gauntlet, run for the other side as only Large Lot Traders are likely to be able to march through this, If we break into this gauntlet and sit, it will likely be a short timeframe trader.


VOLUME ACTION
  • Light volume today
  • Last three days have been subaverage volume
  • Daily range below standard (makes sense as we are 1) in white space on NQ, 2) filling LVAs on ES, and 3) Two weeks before an election.


  • NQ OBV shows ~5k contracts liquidated (makes sense as we discussed the need for the accumulator of the prior few week’s need to mark up distribute, and that we are near the top)
  • ES OBV shows approximately a net no-change (makes sense as we are simply filling in an LVA)


  • Last weeks round bottom indeed broke out long, and right into defined resistance.
  • Judging from the aftermarket, we will be going short for tomorrow.

Price action is showing me that NQ appears to be rejecting higher prices near contract high while the ES is rejecting higher HVA -  I will be looking for profit taking selling tomorrow and back into value.


Monday, October 24, 2016

Barnacle Islands and Spackle Touchup....


With two weeks to go to the elections, we are definitely in hunker down mode yet we had a change in the market. Over the weekend, price made a very interesting leapfrog move. From the 90 day view it shows up and shows up better after zooming in....
Price Leapfrogging Into the Next Auction Area.


Interesting is how the ES is now riding a major trend line:
Today's price action


NQ left a gap this morning from 4645 - 4876
  • The NQ did a nice leapfrog
  • NQ had clear targets on ATH
  • Volume was 86% average (matching last friday)
  • That the NQ “parachuted overnite”  the and flew over the Gauntlet of MP spikes means to me, short time frame trader did this (i.e. perhaps the guy stuck buying all the large lot selling the last couple of weeks???   By marking up during the overnight, this trader has created instant wealth for his holdings.
  • In my opinion, this trader will attempt to liquidate all the inventory he bought the past two weeks, at this present level and at the same time, create a new barnacle island.   This barnacle island growing would be painfully slow but compatible with the ES doing spackle touch up work (see below)
  • Rationale to go short and close the gap does not appear tidy with the Gauntlet MP High volume prices in the way - The Leap frogger’s trading buddy…..  (dunno).
  • All of the above discussion, what I would do if I were big money, goes out the window of something happens.
  • Otherwise, we’ve two more weeks before elections with no idea where this boat is going….


ES left a gap this morning from 2135-2140
  • Today’s ES distribution was like a spike on volume 63% of daily average
  • I’m calling this a touch up spackle day
  • Rationale to go short  (close gap)
  • Rationale to stay put (fill in LVA 2142-2145
  • Rationale to go long (fill in LVA (2145-2152)


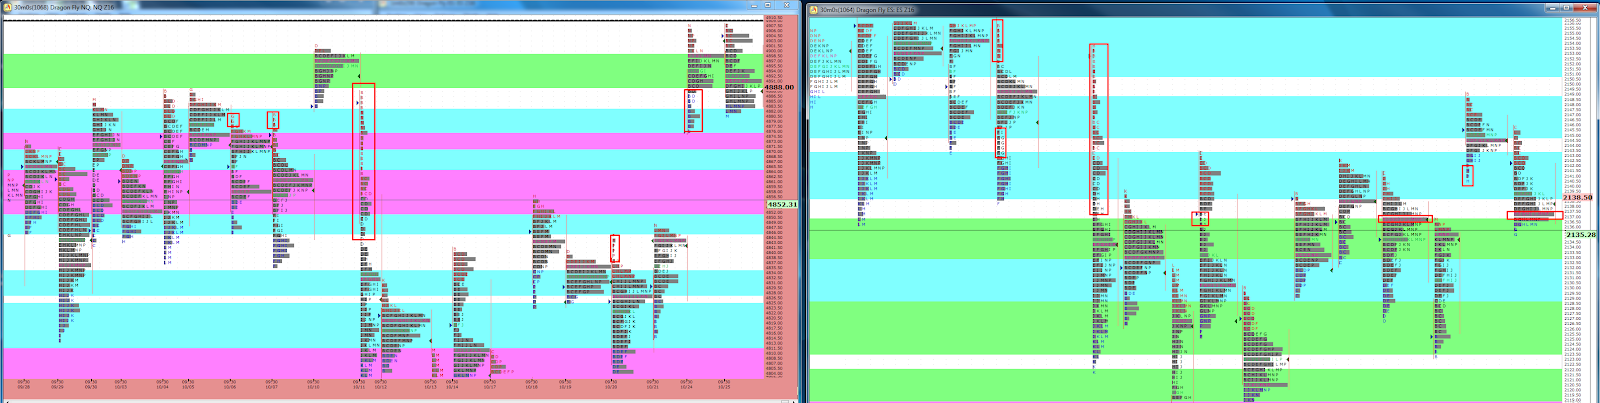
We have not been in this region since 10/11/2016.   Inspecting auctions in this range, there are many multidistribution days and days with multiple POCs.   Today’s range was ridiculously narrow...
A look back is necessary to observe prior trading in this area.

We have not been in this area since October 11 - A review of the composite MP finds jagged terrain.   Perhaps we are cursed for the next few days of filling in narrow LVAs?   Otherwise, there are plenty of MP targets to take reverses off of.


Summary: Last time we were in NQ white space, volume and action was very lethargic. Today, we also had LVA's filled in on the ES and there are several more LVA's in the area.

Unless something happens, I believe this will be the order of business awhile.

Friday, October 21, 2016

Post Andrew Smith Dinner

A quiet week - The summer heat waves have finally subsided and thank goodness for the Andrew Smith dinner last night...

This is the 30th blog I've posted - Thanks for letting me do this as it has helped me tremendously bring order into the deluge of information I've taken in over the past year, where it became apparent that a QE bolstered market was a thing of the past and a better understanding was needed.

First, the usual run down, a trade review, and then some loose thoughts...

Big Picture - No Change.  The three equities are filling in marked areas and proceeding with intraday in-balance trading rules. For the while, even oil appears to be settling. As I've become more efficient in the daily routine, I will start rotating in different charts of interest.


VOLUME ACTION
  • Large lot buyers appeared today, unable to bring the round bottom up above horizontal support
  • With all the large lot selling at the lows of the past two weeks, I’m again surprised price did not collapse, meaning to me a skilled operator is driving the bus.
  • In the spirit of “no change” I would think whoever is buying all this inventory will be needing to mark up price soon
  • I'm thinking for better legibility, discarding the ADX and MACD panels on this view.


STRUCTURAL ACTION
- Throughout the day, multiday lookback MP features played a part during today's live action. Seeing this play out over a period of hours helps make the day make sense

- Today’s ES pit was very responsive to the globex action (this is a recent change). This evidence supports the need to pay attention to the global playing field

- The NQ continued to fill in the identified LVA (as called)
- The ES continued to fill in the identified HVA (as called)
- This continues to be a sign of Short Term Money in charge of the market.

- What it will take to break out of this area, I’m suspecting it’ll have to be big news or the elections. (although I do have a theory in my mind that with all of the algos trading upon observable reference points, we may be having a dynamic damping of what used to be human driven action)


YESTERDAY'S Price Action:
Interesting - LOTS of visual levels near today’s settle.  
After the morning test low, a single linear climb was observed all day
On Balance Volume indicates buying (for a change)
Afternoon Trend - Long, yet unable to gain high acceptance (for now)
Cash out:  Mixed….  ES Short Cover, NQ Liquidation


PRIOR DAY TRADE REVIEW:

0841 Premarket Position - Volume Wave Trigger.
0900 Premarket Position - Volume Wave Trigger
At first glance, both of the above entries would've required a bot to detect.

1027 RTM(20) - Somewhat risky as this was heading back into the open yet demonstrated a normal day distribution taking place over the entire day (and not just during the initial balance period)

1340 Retest and GapFill (flinched on a couple false entries wiped out morning profits)  Observe how price didn’t cleanly bounce off SMA 200, rather, the prior day POC. I would call this a blown play that scored anyway.
Price action Trade Review.   At the end of the day, several were able to trade off the HVA edge.
False entries during the mid day rally - Sloppy alignments and trying to go long on the after lunch breakout wiped out morning profits, yet netted positive for the day.


END OF DAY CARRYOVER SUMMARY:   

  • Afternoon trend was long suggesting long carry over
  • If I were big money, next Monday, I'd have to decide if Im going to the level above or stay in the present level
  • If I were the big money that bought all the large lot sales over the past two weeks, I am getting in need of marking price up for a profitable distribution.
  • If I am big money that's been selling at these levels, I would not wish for price to go lower in order to sell at the best price I can.
  • By Next Tuesday, a review of progress on the entire contract to see if a revisit lower is necessary
  • If I am big money, I'm likely rotating my portfolio based on earnings reports as options expire today in a manner were even if the composite average does not move, my holdings will reflect earnings news and the upcoming elections.

Perhaps another week of musical chairs?