Friday, February 3, 2017

February COT Review


Last week, the equities hit all time highs.   An examination of the Commitment of Traders is performed:


Tuesday, January 31, 2017

Spring Cleaning

Been absorbing new methods and streamlining the workflow greatly improving understanding an efficiency (not sure how well the graphics will expand in the actual blog)

So we are heading into February, which is one of the weakest months for the Dollar and the strongest month for Oil during the past 10 years.


Summary:


4 Hour Action:
  • Gold putting in a triple top and expanding triangle
  • Precarious gaps observed in the Equities MP structures
  • Natural Gas putting in a midstream “M” - watch for breakout!
  • Crude happily in range, watch for February breakout


30 Minute Action:
  • GC is clearly inverse of Equities (confluence)
  • YM & ES clearly returned to basecamp
  • NQ stair stepping higher
  • NG Taylor series suggests long tomorrow
  • CL in range
  • GC creating a triple top on Fib 50
  • GC possibly putting in an expanding wedge


Trade Review:
  • Starting new ledger


Carry Over Conclusions & Today’s Ruling Reason:
  • Meeting tomorrow morning - No trading
  • Stay safe, FOMC is meeting
  • Stay safe, Trump news continues
  • Revisit possible pull back levels

Wednesday, January 25, 2017

Trump's Wall

Summary:

The equities, all on the proper side of their respective Composite POC’s made a move in formation to all time highs.   The move was grinding methodical and the POC & Settle were at the top.   We have a solid base with Trump’s Wall to stairstep higher.

Speaking of Trump’s Wall, the POTUS announced going ahead with the wall.   XLB did well today taking the Dow with it.   The Dow also took along the S&P (understandably)  and the Nasdaq (for some reason).   To finance the move, Gold prices fell $2/ounce today.

Oil is happily going nowhere building value in this current contract at prior contract levels.   Natural gas is moving in iRobot fashion
.


High correlation with the equities & gold...


Had a killer gold trade reading the dailies, the fibs, and the signals…
  • Contract Fibs said pullback possible
  • Double tops put in a 50% fib followed by a lower swing
  • Confirmation retest made before liquidation started
  • Liquidation went all night
  • I believe the proceeds were used to buy up equities (confirm with next week’s COT)


Carry Over Conclusions & Today’s Ruling Reason
  • Today’s volume climb was done on relatively nominal overall volume
  • (yesterday was when all the heavy buying took place, probably burned through supply)

  • Overnight globex appears to be continuing the runup.
  • Attempt equity entry with a large trail at correct pullback level (need more alarms)
  • Consider Gann
  • Consider big move for the week is done and commence target trading

Saturday, January 21, 2017

YM Review


For quite some time, the Dow has been steadily sinking further away from it's failed attempt at reach the 20,000 level and recently tested contract low areas.

We are in key support/resistance levels in the Dow and closeup examination shows signs of possible rotation to the sinking trend and perhaps another 1.5% assault on the 20,000 level else the possibilities of a near 3% drop to the next lower level of support, not unheard of...


The short entry would occur monitoring for round top breakouts.

The long entry would occur after a break out long with retest.

To be continued...

Tuesday, January 17, 2017

Power of the Globex


Price action during the Globex overnight session comes in all varieties....

One of the classic moves is to relocate "price" while nobody is around to protest:


Sunday, January 15, 2017

Gold Revisited


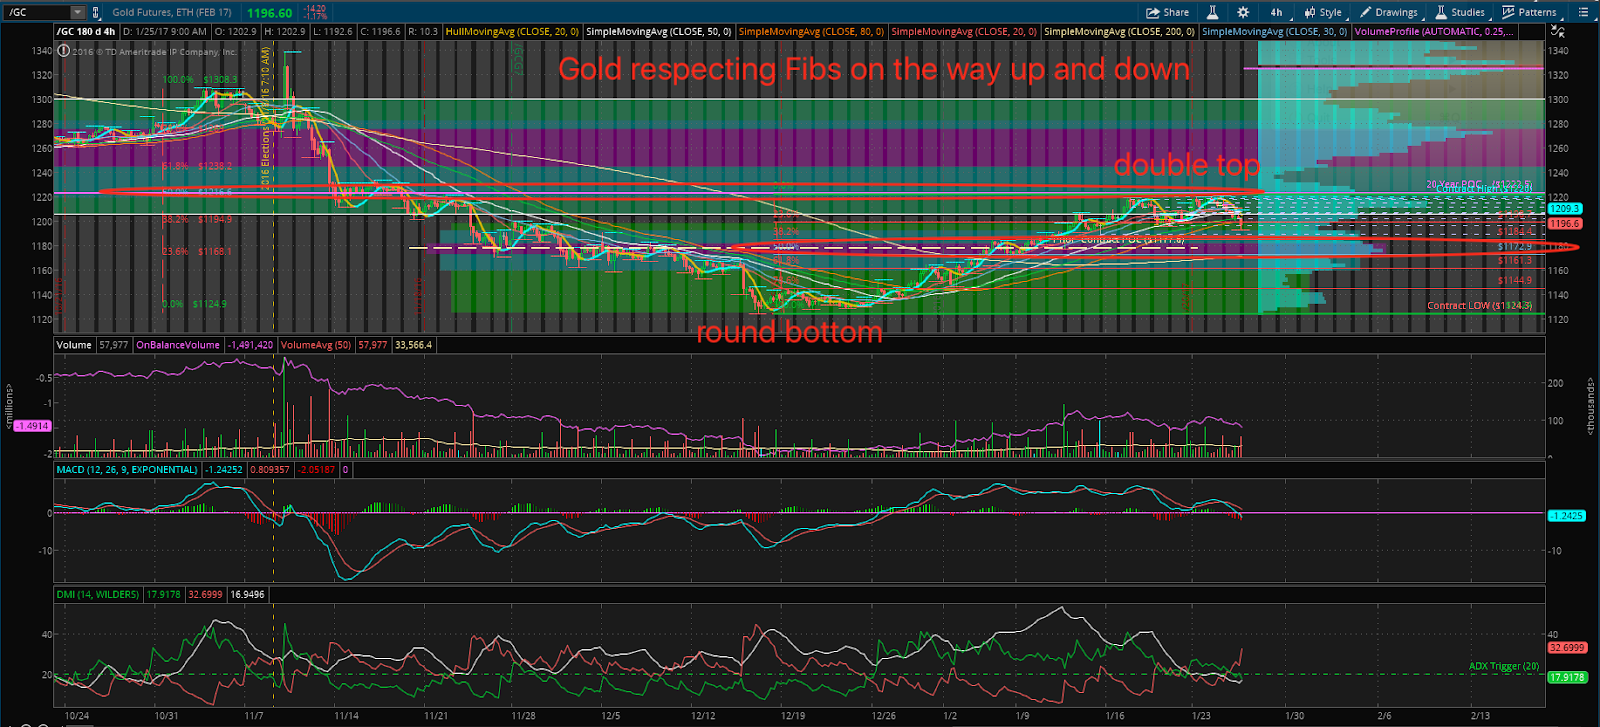
In a recent blog entry, we observed gold putting in a round bottom - A follow up examine is of interest.


The 20 year long month time frame view shows gold directly below it's 20 year Point of Control after rejecting defined resistance.  Day trading experience suggests chop at this location.


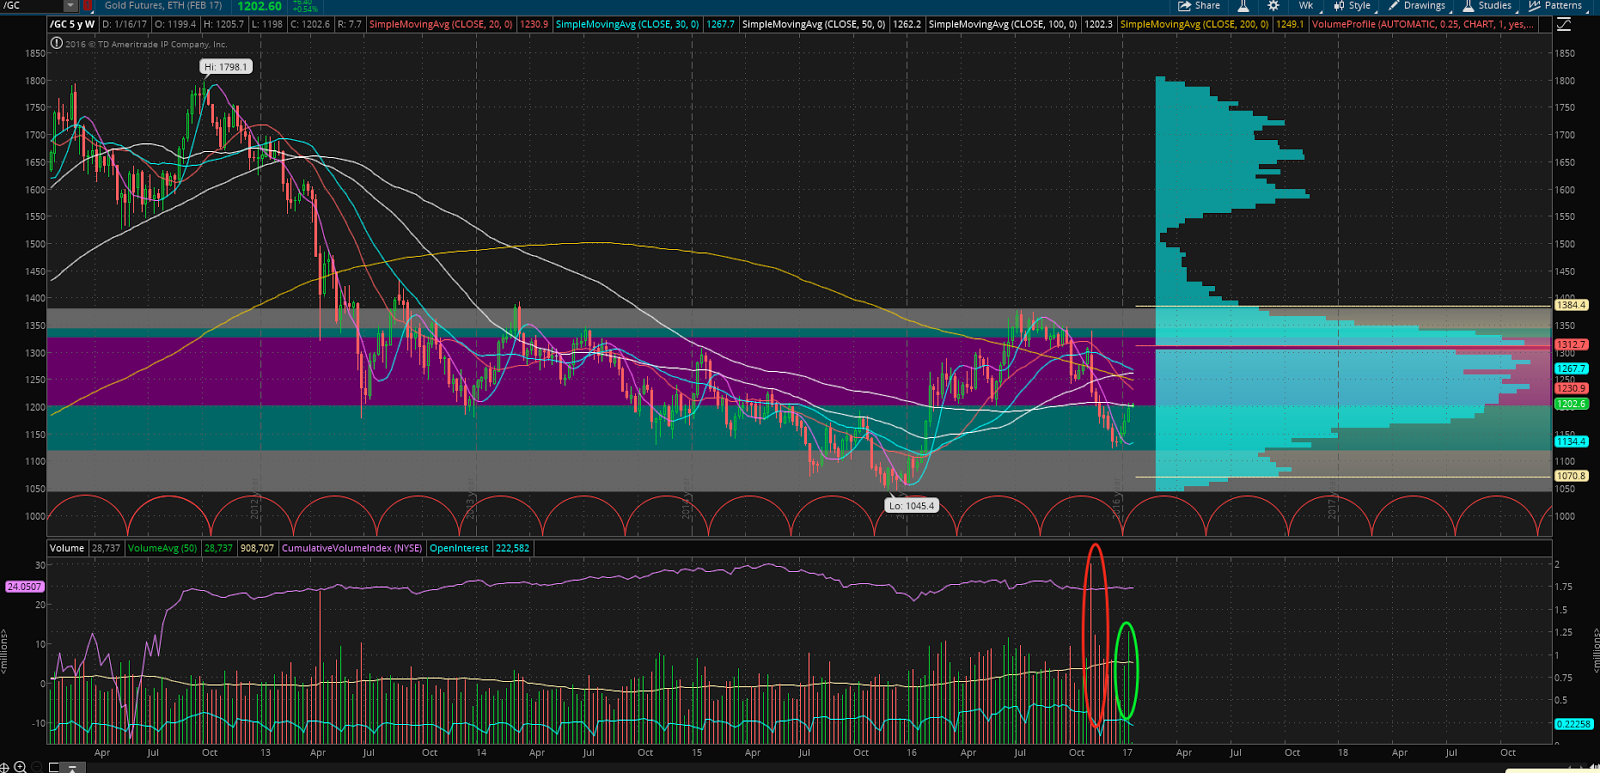
A 5 year weekly view agrees with the monthly time frame review "plus" shows the arrival of buyers.


The Daily View shows the buyers in an increasing presence, rescued of trapped traders, and possible targets.


Finally, with a 4 hour view, trapped traders back from November are identified as targets.   A 30 minute view can't reach back that far.  

Confusing is that these trapped traders occurred prior to the contract rollover - My hunch is that spread traders may have placed positions there prior to the rollover.     {follow up}  

Otherwise a rotation short is possible against a defined edge, an edge of a POC, and requires an exception initiating trades off composite POCs.

Natural Gas Revisited

A few days ago in a prior blog entry, we noticed that NG had tested and rejected price at a specific historical price level - Another review seemed appropriate using different time scales.


A look at the five year span, we see price rejecting the low at 3.098 and also rejected the price from approximately 2 years ago - It would seem natural for price to fill in the adjacent Low Volume Area.


A one day timeframe analyses is conducted.   From here, we can see price homing in on a specific Low Volume Area (and perhaps settling)


Finally, a 30 minute view is performed zooming in on the recent price rejection also corresponding with a composite High Volume Area Point of Control (purple) and an MP anomaly consisting of a string of single prints.    

Interesting is the declining On Balance Volume indictor suggesting Liquidation.   A neutral trading area and a long trading area are suggested.